File
advertisement
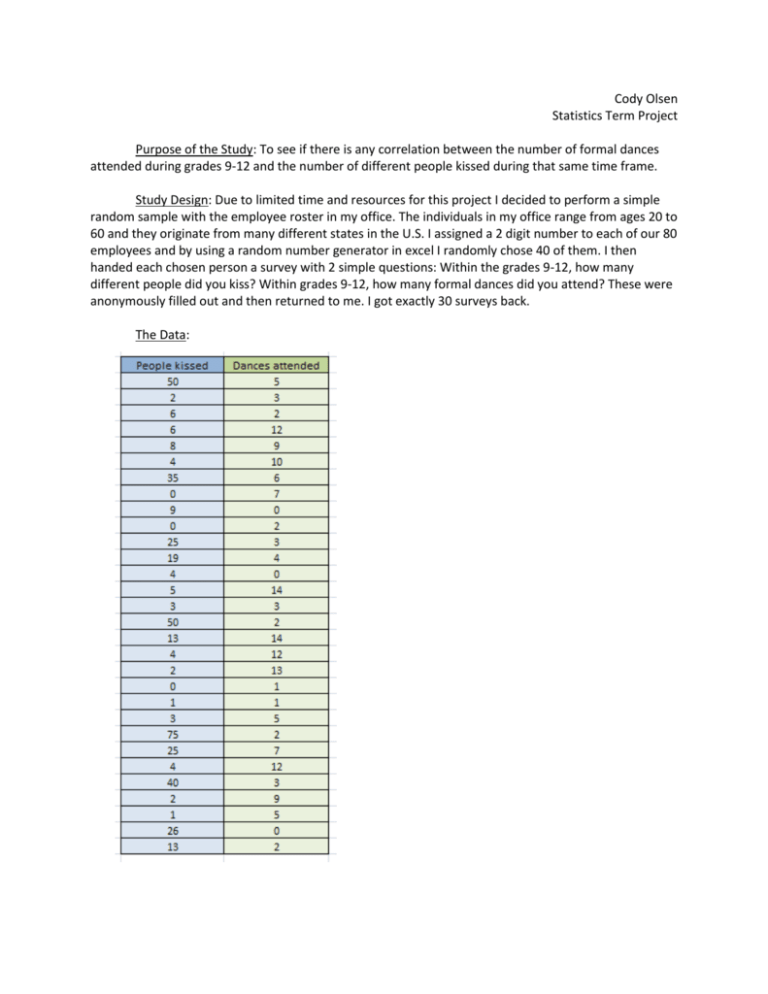
Cody Olsen Statistics Term Project Purpose of the Study: To see if there is any correlation between the number of formal dances attended during grades 9-12 and the number of different people kissed during that same time frame. Study Design: Due to limited time and resources for this project I decided to perform a simple random sample with the employee roster in my office. The individuals in my office range from ages 20 to 60 and they originate from many different states in the U.S. I assigned a 2 digit number to each of our 80 employees and by using a random number generator in excel I randomly chose 40 of them. I then handed each chosen person a survey with 2 simple questions: Within the grades 9-12, how many different people did you kiss? Within grades 9-12, how many formal dances did you attend? These were anonymously filled out and then returned to me. I got exactly 30 surveys back. The Data: Statistics for testing correlation Difficulties, Surprises encountered: One difficulty or surprise that I came across was in the actual verbiage of the survey question. I did have 2 people ask me what qualified as a “formal dance”. I did answer their question and I sent a communication out to the rest of those being surveyed explaining what a formal dance would be. This could be difficult because some of those being surveyed could have interpreted “formal dance” differently. Looking back, I could have found a better way to phrase that question. Analysis: Both of my variables had right skewed distributions. The “People kissed” Variable was more skewed having a mean of 14.5 and an outlier of 75. “Dances attended” was also right skewed but did not have any outliers. The critical value for a correlation coefficient of a sample size of 30 is 0.361. The correlation coefficient from my sample is -0.256. The data from my sample has a weak negative correlation. Interpretation and Conclusions: The data gathered proved to have a weak negative correlation. The information gathered has too weak of a relationship to make any strong predictions when it comes to the two response variables. The information did turn out somewhat how I did predict in that the very high number and low numbers of “people kissed” both shared low number of “dances attended” for the most part. A simple color scale in excel allowed me to see that. But I do believe that any prediction made using one response variable to predict the other would not carry much confidence. People kissed 75 50 50 40 35 26 25 25 19 13 13 9 8 6 6 5 4 4 4 4 3 3 2 2 2 1 1 0 0 0 Dances attended 2 5 2 3 6 0 3 7 4 14 2 0 9 2 12 14 10 0 12 12 3 5 3 13 9 1 5 7 2 1
