Algebra 2
advertisement
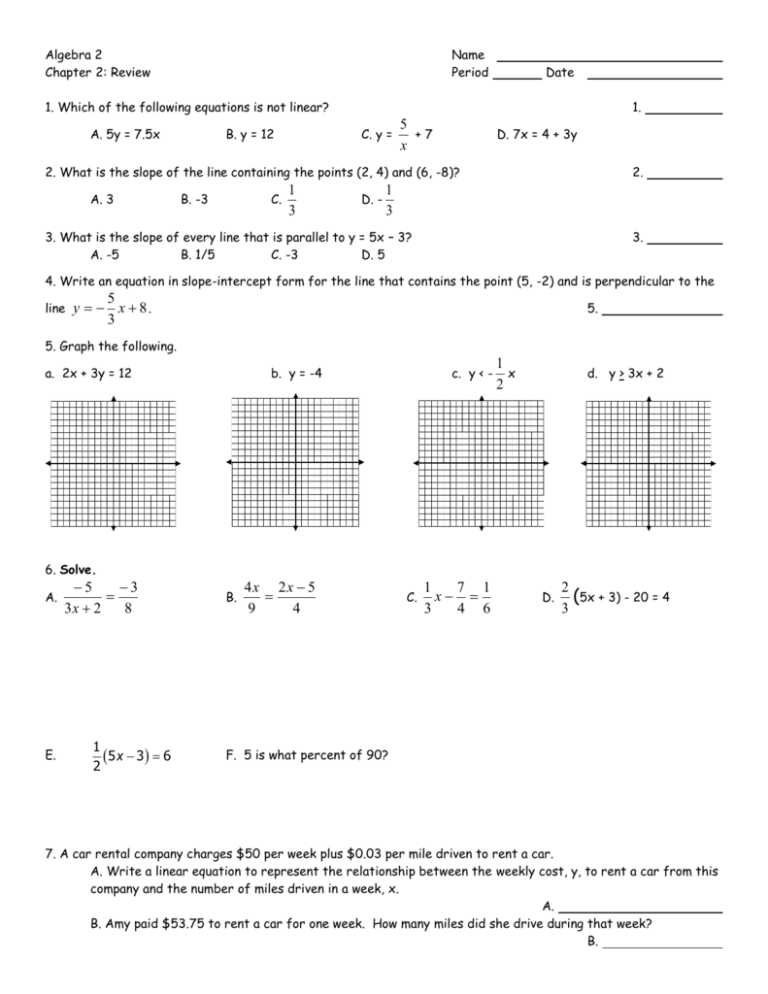
Algebra 2 Chapter 2: Review Name Period Date 1. Which of the following equations is not linear? A. 5y = 7.5x B. y = 12 1. 5 C. y = +7 x D. 7x = 4 + 3y 2. What is the slope of the line containing the points (2, 4) and (6, -8)? A. 3 1 C. 3 B. -3 2. 1 D. 3 3. What is the slope of every line that is parallel to y = 5x – 3? A. -5 B. 1/5 C. -3 D. 5 3. 4. Write an equation in slope-intercept form for the line that contains the point (5, -2) and is perpendicular to the line y 5 x 8. 3 5. 5. Graph the following. a. 2x + 3y = 12 b. y = -4 6. Solve. A. E. 5 3 3x 2 8 1 5 x 3 6 2 B. 4x 2x 5 9 4 c. y < - C. 1 7 1 x 3 4 6 1 x 2 d. y > 3x + 2 D. 2 (5x + 3) - 20 = 4 3 F. 5 is what percent of 90? 7. A car rental company charges $50 per week plus $0.03 per mile driven to rent a car. A. Write a linear equation to represent the relationship between the weekly cost, y, to rent a car from this company and the number of miles driven in a week, x. A. B. Amy paid $53.75 to rent a car for one week. How many miles did she drive during that week? B. 8. The number of home runs hit by a player is shown below. 1990 1991 1992 1993 1994 39 22 42 9 9 1995 39 1996 52 A. Find the equation of the least-squares line. 1997 58 1998 70 1999 65 A. B. Find the correlation coefficient, r, to the nearest hundredth. B. C. Use the least-squares line to predict the number of home runs the player will hit in 2000. __________ For the following 3 problems, state whether the statement is true or false. 9. A correlation coefficient can be equal to -2. 9. 10. 10. 11. If the slope of a least-squares line is negative, then the correlation. coefficient is negative A data set with a correlation coefficient of -0.72 has a stronger linear relationship than a data set with a correlation coefficient of 0.64. Solve and graph the following inequalities. 12. 2 (x – 12) x + 5 3 13. 5 1 2 1 x x 3 4 3 6 14. 11. 4x + 6 > -10 and -3x – 5 > -17 Solution: Solution: Solution: Graph: Graph: Graph: 15. 4x 3 3 5 16. 1 – 2b = 5 17. 18-4y= -2(2y -9) Solution: Solution: Solution: Graph: Graph: Graph:
