Activity II: What`s your function?
advertisement

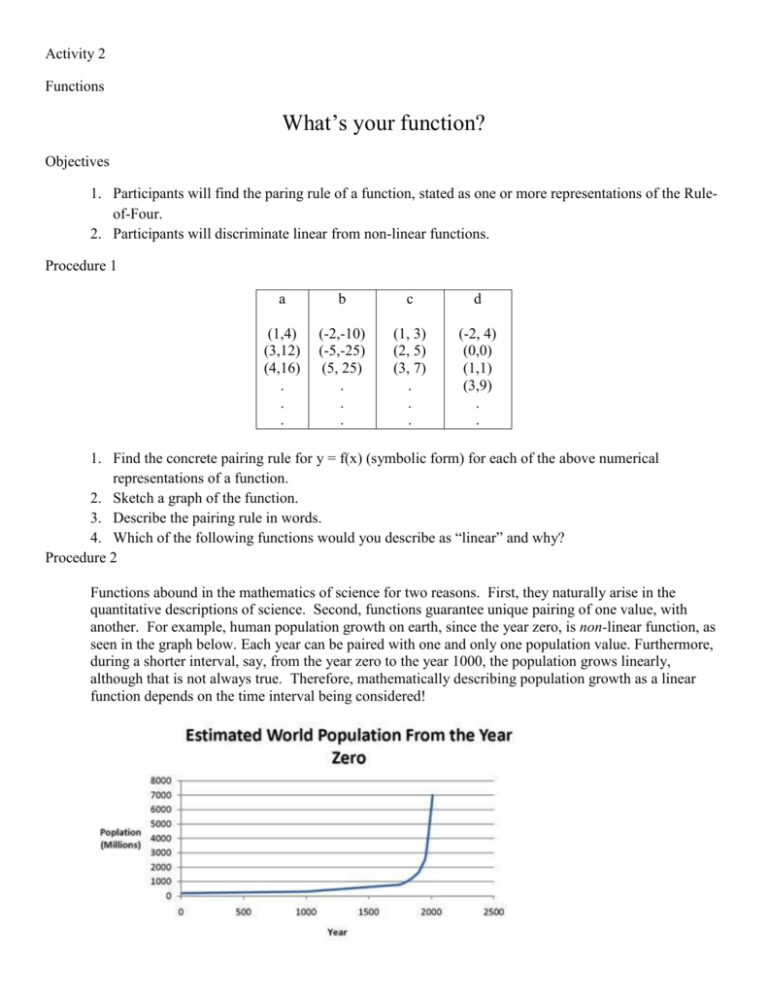
Activity 2 Functions What’s your function? Objectives 1. Participants will find the paring rule of a function, stated as one or more representations of the Ruleof-Four. 2. Participants will discriminate linear from non-linear functions. Procedure 1 a b c d (1,4) (3,12) (4,16) . . . (-2,-10) (-5,-25) (5, 25) . . . (1, 3) (2, 5) (3, 7) . . . (-2, 4) (0,0) (1,1) (3,9) . . 1. Find the concrete pairing rule for y = f(x) (symbolic form) for each of the above numerical representations of a function. 2. Sketch a graph of the function. 3. Describe the pairing rule in words. 4. Which of the following functions would you describe as “linear” and why? Procedure 2 Functions abound in the mathematics of science for two reasons. First, they naturally arise in the quantitative descriptions of science. Second, functions guarantee unique pairing of one value, with another. For example, human population growth on earth, since the year zero, is non-linear function, as seen in the graph below. Each year can be paired with one and only one population value. Furthermore, during a shorter interval, say, from the year zero to the year 1000, the population grows linearly, although that is not always true. Therefore, mathematically describing population growth as a linear function depends on the time interval being considered! Activity 2 Functions Blips in the population rate: Activity 2 Functions Slopes of straight line segments represent change, in this case, the average change in population per unit time. 1. A smart student disagrees that the above graph represents a function by commenting: “It’s possible that during any one year in history, the population of the world is NOT unique. Therefore, the graph cannot represent a function!” Is this student correct or not? 2. Estimate the change in the world population from the year 0 to the year 1000. 3. Estimate the average rate of change in the world population from the year 0 to the year 1000. 4. *Estimate the change in the world population from the year 1000 to the year 1800. 5. *Estimate the average rate of change in the world population from the year 1000 to the year 1800. 6. *For which years is the population growing the fastest? The slowest? 7. *Estimate the average population rate of growth between the years 1500 and 2000. 8. Approximately, at which year between 1500 and 2000 is the instantaneous rate of change equal to the average rate of change between 1500 and 2000? The instantaneous rate of change is the slope of a line tangent to the population curve. That tangent line represents a linear projection based on the average growth rate during those 5000 years. 9. * Approximately, at which year between 1800 and 2000 is the instantaneous rate of change equal to the average rate of change between 1800 and 2000? Formalism: A linear function f is one with two properties: 1. f(x+y) = f(x) + f(y) 2. f(ax) = a(f(x)) These rules seem odd until we use number substitutes and understand a few uses. In essence, a linear function f must have i) the distributive property of multiplication over addition and ii) the commutative property of multiplication. The slope of the line IS the defining characteristic of a linear function! Activity 2 Functions Procedure 3 (What is linear, really?) Decide solutions in groups 1. Which of the pairing rules in Procedure 1 describes a linear function? 2. Recall the definitions from algebra of the “slope” of a line and the y-intercept of a line. Describe the slope and the y-intercept in terms of linear functions. 3. Use the rule of four to describe four linear functions: a. Positive slope b. Negative slope c. Zero slope d. Infinite slope


