Grade 8
advertisement
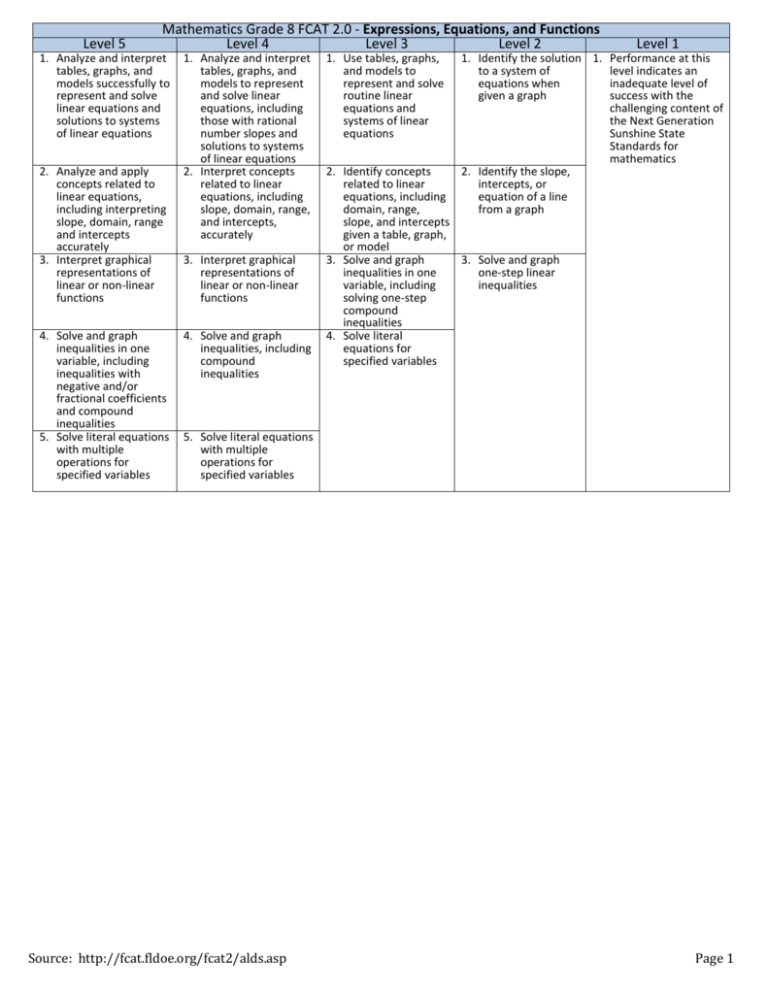
Level 5 Mathematics Grade 8 FCAT 2.0 - Expressions, Equations, and Functions Level 4 Level 3 Level 2 1. Analyze and interpret tables, graphs, and models successfully to represent and solve linear equations and solutions to systems of linear equations 2. Analyze and apply concepts related to linear equations, including interpreting slope, domain, range and intercepts accurately 3. Interpret graphical representations of linear or non-linear functions 4. Solve and graph inequalities in one variable, including inequalities with negative and/or fractional coefficients and compound inequalities 5. Solve literal equations with multiple operations for specified variables 1. Analyze and interpret tables, graphs, and models to represent and solve linear equations, including those with rational number slopes and solutions to systems of linear equations 2. Interpret concepts related to linear equations, including slope, domain, range, and intercepts, accurately 3. Interpret graphical representations of linear or non-linear functions 4. Solve and graph inequalities, including compound inequalities 1. Use tables, graphs, and models to represent and solve routine linear equations and systems of linear equations Level 1 1. Identify the solution 1. Performance at this to a system of level indicates an equations when inadequate level of given a graph success with the challenging content of the Next Generation Sunshine State Standards for mathematics 2. Identify the slope, intercepts, or equation of a line from a graph 2. Identify concepts related to linear equations, including domain, range, slope, and intercepts given a table, graph, or model 3. Solve and graph 3. Solve and graph inequalities in one one-step linear variable, including inequalities solving one-step compound inequalities 4. Solve literal equations for specified variables 5. Solve literal equations with multiple operations for specified variables Source: http://fcat.fldoe.org/fcat2/alds.asp Page 1 Level 5 1. Analyze and apply similarity and/or the Pythagorean theorem to solve problems that include heights and distances 2. Analyze and determine the measures of angles in problems that require multiple steps to solve 3. Compare and convert units of measure, including dimensions of area, volume, and capacity, both within and between measurement systems Mathematics Grade 8 FCAT 2.0 - Geometry and Measurement Level 4 Level 3 Level 2 1. Apply similarity and/or the Pythagorean theorem to solve problems that include heights and distances 2. Analyze and determine the measures of angles 1. Use similar triangles to solve routine problems 1. Use similar triangles to solve routine problems where the triangles have the same orientation in space 2. Use the Pythagorean theorem to solve routine height or distance problems 3. Compare and convert units of measure both within and between measurement systems 3. Classify and determine the measures of angles, including angles in polygons and angles created by intersecting lines 2. Use the Pythagorean theorem to solve routine height or distance problems when given the measures of both legs 3. Determine the measures of angles in triangles and identify the measures of angles that are corresponding or vertical 4. Convert units within a system of measure and linear units between systems 4. Compare and convert units of measure within a system of measure and linear units between systems Source: http://fcat.fldoe.org/fcat2/alds.asp Level 1 1. Performance at this level indicates an inadequate level of success with the challenging content of the Next Generation Sunshine State Standards for mathematics Page 2 Level 5 Mathematics Grade 8 FCAT 2.0 - Number: Operations, Problems, and Statistics Level 4 Level 3 Level 2 1. Solve problems that 1. Represent and include performing compare numbers operations on numbers using scientific written in scientific notation notation Level 1 1. Represent numbers using scientific notation 1. Identify the correct 1. Performance at this exponent when level indicates an converting a number inadequate level of greater than one in success with the standard form to challenging content of scientific notation the Next Generation Sunshine State 2. Perform operations 2. Perform one-step Standards for on real numbers, operations on real mathematics including, but not numbers, including, limited to, radical but not limited to, expressions and radical expressions absolute value and absolute value 3. Simplify real number 3. Identify a positive or expressions using the a negative trend in a law of exponents scatter plot 2. Represent and compare 2. Perform operations numbers using scientific on real numbers, notation including, but not limited to, radical expressions and absolute value 3. Identify and/or apply 3. Simplify real number generalizations about expressions using the the effects of law of exponents operations on real numbers 4. Perform operations on 4. Select, organize, or 4. Identify trend lines in 4. Identify the mode real numbers, including, construct the most a scatter plot and range from a but not limited to, appropriate display data display radical expressions and for a given data set, absolute value including box-andwhisker plots, scatter plots, and lines of best fit 5. Simplify real number 5. Generalize statements 5. Identify the measures expressions using the about data, including of central tendency law of exponents data displayed in a from a data display scatter plot or boxand-whisker plot 6. Select, organize, and 6. Determine how 6. Determine a missing construct the most changes in a given set number in a set of appropriate display for of data impact the data given the values a given data set, mean, median, or of the measures of including box-andmode of the data set central tendency of whisker plots, scatter the data set plots, and lines of best fit 7. Generalize statements 7. Determine a missing about data, including number in a set of data displayed in data given the values scatter plots or boxof the measures of and-whisker plots central tendency of the data set 8. Extrapolate data from a given display to solve problems 9. Analyze how the measures of central tendency and variability of a data set are affected by including or excluding additional data points 10. Determine a missing number in a set of data given the values of the measures of central tendency of the data set Source: http://fcat.fldoe.org/fcat2/alds.asp Page 3


