Microsoft Word - Primary_Production_Lab_Activity.doc
advertisement
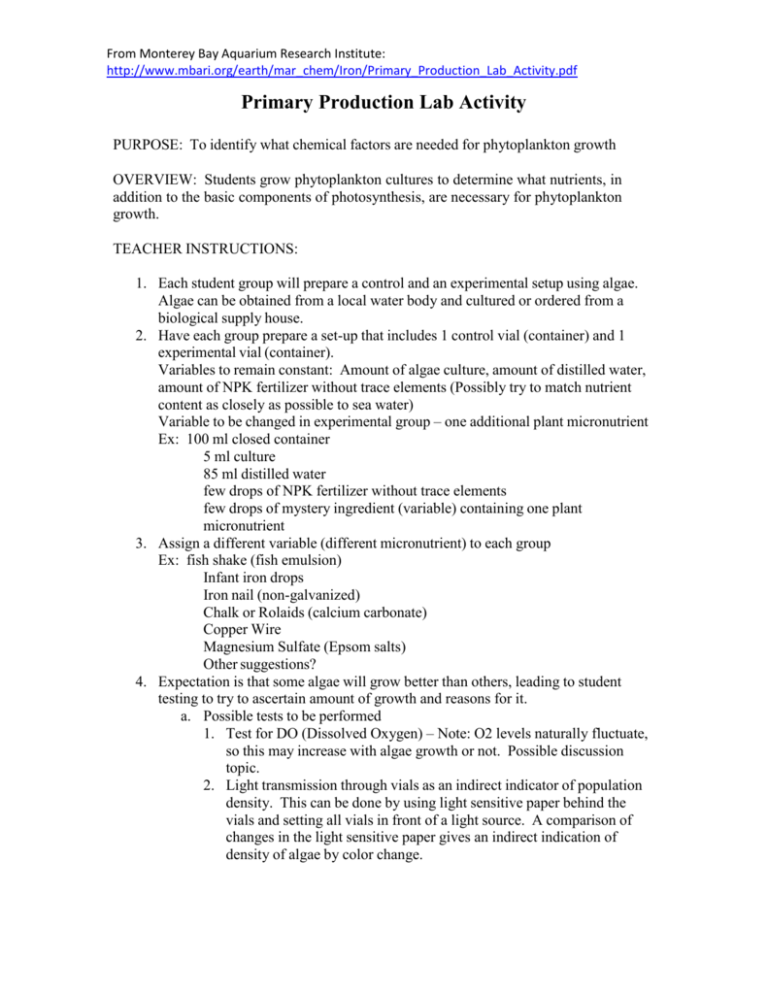
From Monterey Bay Aquarium Research Institute: http://www.mbari.org/earth/mar_chem/Iron/Primary_Production_Lab_Activity.pdf Primary Production Lab Activity PURPOSE: To identify what chemical factors are needed for phytoplankton growth OVERVIEW: Students grow phytoplankton cultures to determine what nutrients, in addition to the basic components of photosynthesis, are necessary for phytoplankton growth. TEACHER INSTRUCTIONS: 1. Each student group will prepare a control and an experimental setup using algae. Algae can be obtained from a local water body and cultured or ordered from a biological supply house. 2. Have each group prepare a set-up that includes 1 control vial (container) and 1 experimental vial (container). Variables to remain constant: Amount of algae culture, amount of distilled water, amount of NPK fertilizer without trace elements (Possibly try to match nutrient content as closely as possible to sea water) Variable to be changed in experimental group – one additional plant micronutrient Ex: 100 ml closed container 5 ml culture 85 ml distilled water few drops of NPK fertilizer without trace elements few drops of mystery ingredient (variable) containing one plant micronutrient 3. Assign a different variable (different micronutrient) to each group Ex: fish shake (fish emulsion) Infant iron drops Iron nail (non-galvanized) Chalk or Rolaids (calcium carbonate) Copper Wire Magnesium Sulfate (Epsom salts) Other suggestions? 4. Expectation is that some algae will grow better than others, leading to student testing to try to ascertain amount of growth and reasons for it. a. Possible tests to be performed 1. Test for DO (Dissolved Oxygen) – Note: O2 levels naturally fluctuate, so this may increase with algae growth or not. Possible discussion topic. 2. Light transmission through vials as an indirect indicator of population density. This can be done by using light sensitive paper behind the vials and setting all vials in front of a light source. A comparison of changes in the light sensitive paper gives an indirect indication of density of algae by color change. From Monterey Bay Aquarium Research Institute: http://www.mbari.org/earth/mar_chem/Iron/Primary_Production_Lab_Activity.pdf 3. Color used as an indicator of population density. Students can construct their own color keys to indicate different colors at different densities and then use them at the end of the experiment as a tool. 4. Mini secci disk to be placed under container and students look down through algae population to determine visibility as an indicator of population density. (Include mini secci disk in teacher materials) 5. Extension for upper level students – sample container every few days and do an actual microscopic count of algal cells to estimate total population b. Extension to experiment – after algal growth experiment is conducted, add small organisms to cultures that will feed on the algae and continue the study to include the population growth of the consumer. How does the addition of the micronutrients affect the growth of the animal population? (Extension of idea of increasing fish populations through ocean iron fertilizing) Test for CO2 Extension to experiment – test control vial and vials with algae growth for the presence of carbon dioxide using an acid indicator (see other lab) Are the results the same? Which vials contain more CO2? Why? STUDENT ACTIVITY: 1. Analysis Question: a. What do you need to increase population growth in phytoplankton? Ex: Enough light, proper temperature, water, carbon dioxide, oxygen, nutrients/organic molecules 2. In this experiment, you will design and set up an experiment to test the effects of certain nutrients on phytoplankton growth. a. Follow set-up directions for lab (from teacher section) b. Predict outcome of your experiment with your group c. Determine what data you can collect every day that will show evidence of increased or decreased phytoplankton growth. 3. Create a table to record your daily data (length of experiment to be determined by teacher) 4. Conclusion: a. Compile class data of growth on a board in the classroom b. Compare results c. Analysis Questions: (Hand in answers to questions) Which variables increased growth? What do these variables have in common? What chemicals might limit primary production in the oceans? ASSESSMENT OF STUDENT UNDERSTANDING: Concept Map Of Primary Production– give each group a list of words, scissors, glue, and a bigger piece of paper. Have them cut out and arrange words in a way that shows their understanding of primary production. From Monterey Bay Aquarium Research Institute: http://www.mbari.org/earth/mar_chem/Iron/Primary_Production_Lab_Activity.pdf WORD LIST: Photosynthesis Sunlight Photic Zone Oxygen Carbon Dioxide Temperature Iron Consumers Respirations Growth/Bloom Biomass Upwelling Nutrients Algae
