Slope vs. Correlation: Understanding the Difference
advertisement
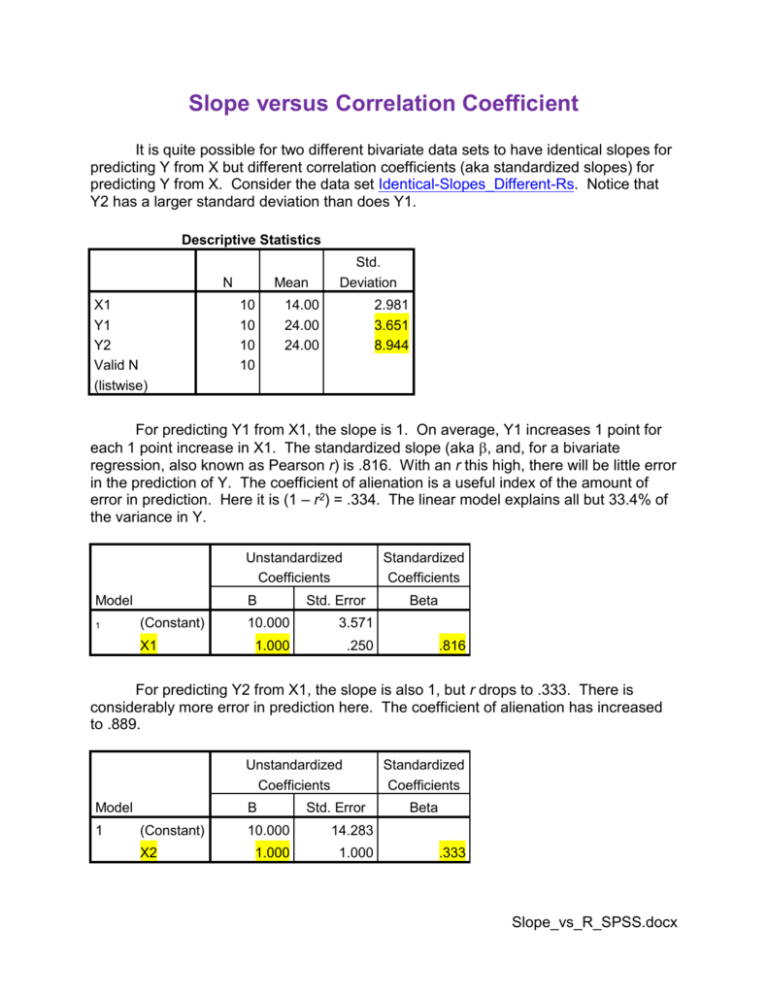
Slope versus Correlation Coefficient It is quite possible for two different bivariate data sets to have identical slopes for predicting Y from X but different correlation coefficients (aka standardized slopes) for predicting Y from X. Consider the data set Identical-Slopes_Different-Rs. Notice that Y2 has a larger standard deviation than does Y1. Descriptive Statistics N X1 Y1 Y2 Valid N (listwise) Mean 10 10 10 10 Std. Deviation 14.00 24.00 24.00 2.981 3.651 8.944 For predicting Y1 from X1, the slope is 1. On average, Y1 increases 1 point for each 1 point increase in X1. The standardized slope (aka , and, for a bivariate regression, also known as Pearson r) is .816. With an r this high, there will be little error in the prediction of Y. The coefficient of alienation is a useful index of the amount of error in prediction. Here it is (1 – r2) = .334. The linear model explains all but 33.4% of the variance in Y. Unstandardized Coefficients Model 1 B (Constant) X1 Standardized Coefficients Std. Error 10.000 3.571 1.000 .250 Beta .816 For predicting Y2 from X1, the slope is also 1, but r drops to .333. There is considerably more error in prediction here. The coefficient of alienation has increased to .889. Unstandardized Coefficients Model 1 B (Constant) X2 Std. Error 10.000 14.283 1.000 1.000 Standardized Coefficients Beta .333 Slope_vs_R_SPSS.docx 2 Looking at scatter plots might help. In the plot on the left, notice how close the actual Y scores are to the predicted Y scores (the regression line). In the plot on the right there are greater deviations between actual Y and predicted Y. Y1 predicted from X1 Y2 predicted from X1 So, now you have seen that the regression for predicting Y from X in two different populations may have identical slopes but different correlation coefficients. Now I shall show you that that the populations can differ with respect to slopes but not correlation coefficients. Y1 Pearson Correlation X1 Y3 .816** .816** .004 .004 10 10 Sig. (2-tailed) N Predicting Y1 from X1 Unstandardized Coefficients Model 1 B (Constant) X1 Standardized Coefficients Std. Error 10.000 3.571 1.000 .250 Beta .816 3 Predicting Y3 from X1 Model Unstandardized Coefficients Standardized t Sig. Coefficients B (Constant) 1 X1 Std. Error 10.000 7.141 2.000 .500 Beta .816 1.400 .199 4.000 .004 For both regressions, the r = .816, but one has a slope of 1 and the other a slope of 2. Y1 predicted from X1 Y3 predicted from X1 Karl L. Wuensch, Dept. of Psychology, East Carolina University, December, 2014.

