BasinwidePredationEstimates.
advertisement
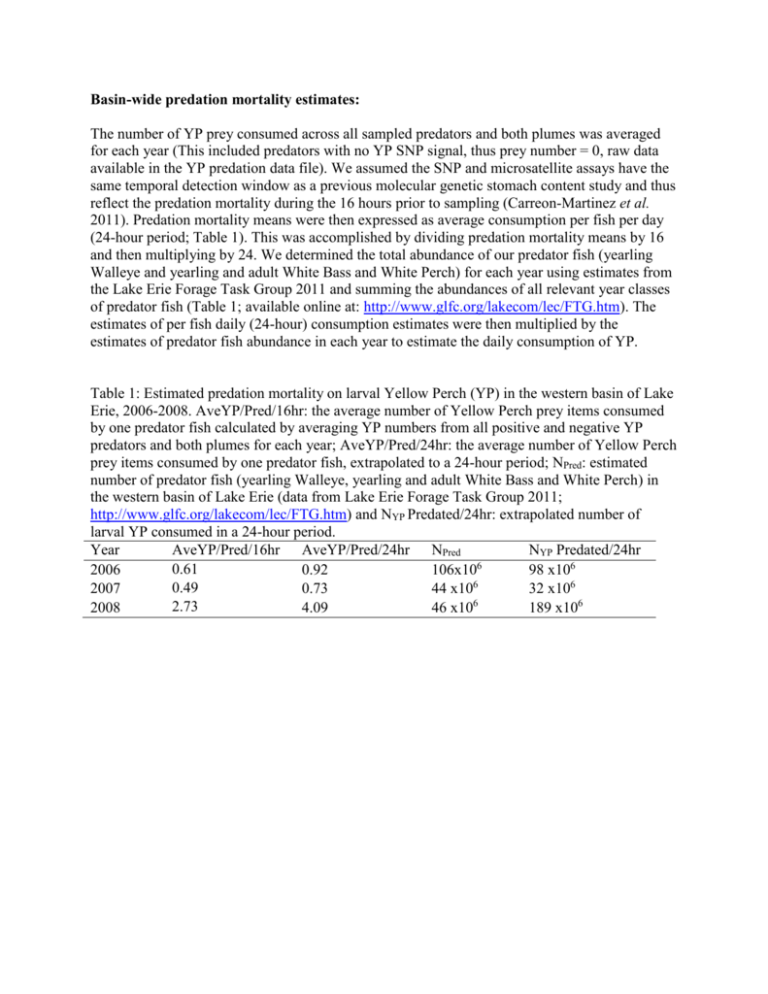
Basin-wide predation mortality estimates: The number of YP prey consumed across all sampled predators and both plumes was averaged for each year (This included predators with no YP SNP signal, thus prey number = 0, raw data available in the YP predation data file). We assumed the SNP and microsatellite assays have the same temporal detection window as a previous molecular genetic stomach content study and thus reflect the predation mortality during the 16 hours prior to sampling (Carreon-Martinez et al. 2011). Predation mortality means were then expressed as average consumption per fish per day (24-hour period; Table 1). This was accomplished by dividing predation mortality means by 16 and then multiplying by 24. We determined the total abundance of our predator fish (yearling Walleye and yearling and adult White Bass and White Perch) for each year using estimates from the Lake Erie Forage Task Group 2011 and summing the abundances of all relevant year classes of predator fish (Table 1; available online at: http://www.glfc.org/lakecom/lec/FTG.htm). The estimates of per fish daily (24-hour) consumption estimates were then multiplied by the estimates of predator fish abundance in each year to estimate the daily consumption of YP. Table 1: Estimated predation mortality on larval Yellow Perch (YP) in the western basin of Lake Erie, 2006-2008. AveYP/Pred/16hr: the average number of Yellow Perch prey items consumed by one predator fish calculated by averaging YP numbers from all positive and negative YP predators and both plumes for each year; AveYP/Pred/24hr: the average number of Yellow Perch prey items consumed by one predator fish, extrapolated to a 24-hour period; NPred: estimated number of predator fish (yearling Walleye, yearling and adult White Bass and White Perch) in the western basin of Lake Erie (data from Lake Erie Forage Task Group 2011; http://www.glfc.org/lakecom/lec/FTG.htm) and NYP Predated/24hr: extrapolated number of larval YP consumed in a 24-hour period. Year AveYP/Pred/16hr AveYP/Pred/24hr NPred NYP Predated/24hr 6 0.61 2006 0.92 106x10 98 x106 0.49 2007 0.73 44 x106 32 x106 6 2.73 2008 4.09 46 x10 189 x106

