Day 34 Notes on Condtional Frequencies
advertisement

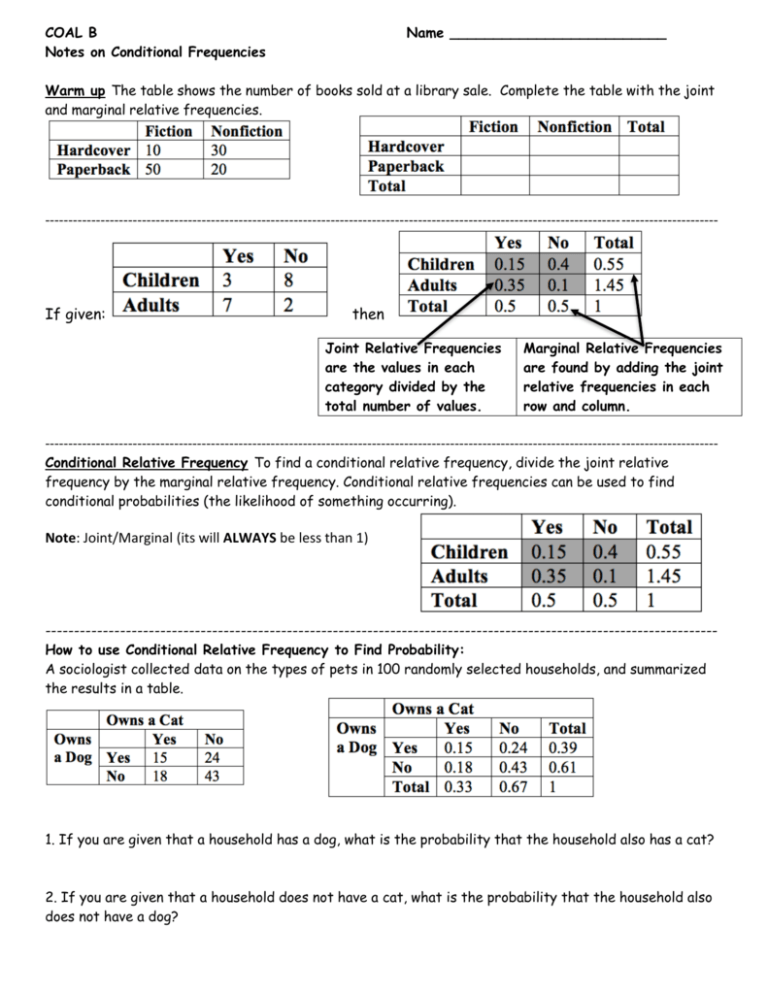
COAL B Notes on Conditional Frequencies Name _________________________ Warm up The table shows the number of books sold at a library sale. Complete the table with the joint and marginal relative frequencies. -------------------------------------------------------------------------------------------------------------------------------------------------- If given: then Joint Relative Frequencies are the values in each category divided by the total number of values. Marginal Relative Frequencies are found by adding the joint relative frequencies in each row and column. -------------------------------------------------------------------------------------------------------------------------------------------------Conditional Relative Frequency To find a conditional relative frequency, divide the joint relative frequency by the marginal relative frequency. Conditional relative frequencies can be used to find conditional probabilities (the likelihood of something occurring). Note: Joint/Marginal (its will ALWAYS be less than 1) --------------------------------------------------------------------------------------------------------------------How to use Conditional Relative Frequency to Find Probability: A sociologist collected data on the types of pets in 100 randomly selected households, and summarized the results in a table. 1. If you are given that a household has a dog, what is the probability that the household also has a cat? 2. If you are given that a household does not have a cat, what is the probability that the household also does not have a dog? The classes at a dance academy include ballet and tap dancing. Enrollment in these classes is shown in the table. Complete the table of the joint relative frequencies and marginal relative frequencies 3. Given that a student is taking ballet, what is the probability that the student is not taking tap? 4. Given that a student is not taking ballet, what is the probability that the student is taking tap? -------------------------------------------------------------------------------------------------------------------------------------------------Tomas is trying to decided on the best possible route to drive to work. Each day he recorded how often he was late or on-time on each route. The corresponding table of joint and marginal relative frequencies is below: What is the probability of being late given Route A? What is the probability of being late given Route B? What is P(being late if driving Route C)? Probability of being late is least on route ______. Classwork/Homework 1. The table shows the joint and marginal relative frequency results of a poll of randomly selected high school students who were asked if they prefer to hear all-school announcements in the morning or afternoon. Underclassmen Morning 0.16 Afternoon 0.36 Total 0.52 Upperclassmen 0.28 0.2 0.48 Total 0.44 0.56 1 a. What percent of the students are underclassmen? b. Given the student is an upperclassman, what is the probability the student prefer to hear the announcements in the afternoon? c. Of the students who prefer to hear the announcements in the afternoon, what percent are upperclassmen? d. What percent of the students prefer morning announcements? Classwork/Homework Continued Name ________________________ 3. The table shows the joint and marginal relative frequency results of a customer satisfaction survey for a cellular service provider, by location of the customer. In the survey, customers were asked whether they would recommend a plan with the provider to a friend. Round to the nearest hundredth where appropriate. Arlington Yes 0.27 No 0.12 Total 0.39 Towson 0.23 0.07 0.3 Parkville 0.27 0.04 0.31 Total 0.77 0.23 1 a. Of the customers who are from Parkville, what percent would recommend a plan with the cellular provider? b. What percent of the customers who said no are from Towson? c. CHALLENGE: Given the customer answered yes, what percent of them were from Towson or Arlington? Classwork/Homework Continued Name ________________________ 3. The table shows the joint and marginal relative frequency results of a customer satisfaction survey for a cellular service provider, by location of the customer. In the survey, customers were asked whether they would recommend a plan with the provider to a friend. Round to the nearest hundredth where appropriate. Arlington Yes 0.27 No 0.12 Total 0.39 Towson 0.23 0.07 0.3 Parkville 0.27 0.04 0.31 Total 0.77 0.23 1 a. Of the customers who are from Parkville, what percent would recommend a plan with the cellular provider? b. What percent of the customers who said no are from Towson? c. CHALLENGE: Given the customer answered yes, what percent of them were from Towson or Arlington?


