APPENDIX We used the following procedure, termed variable
advertisement
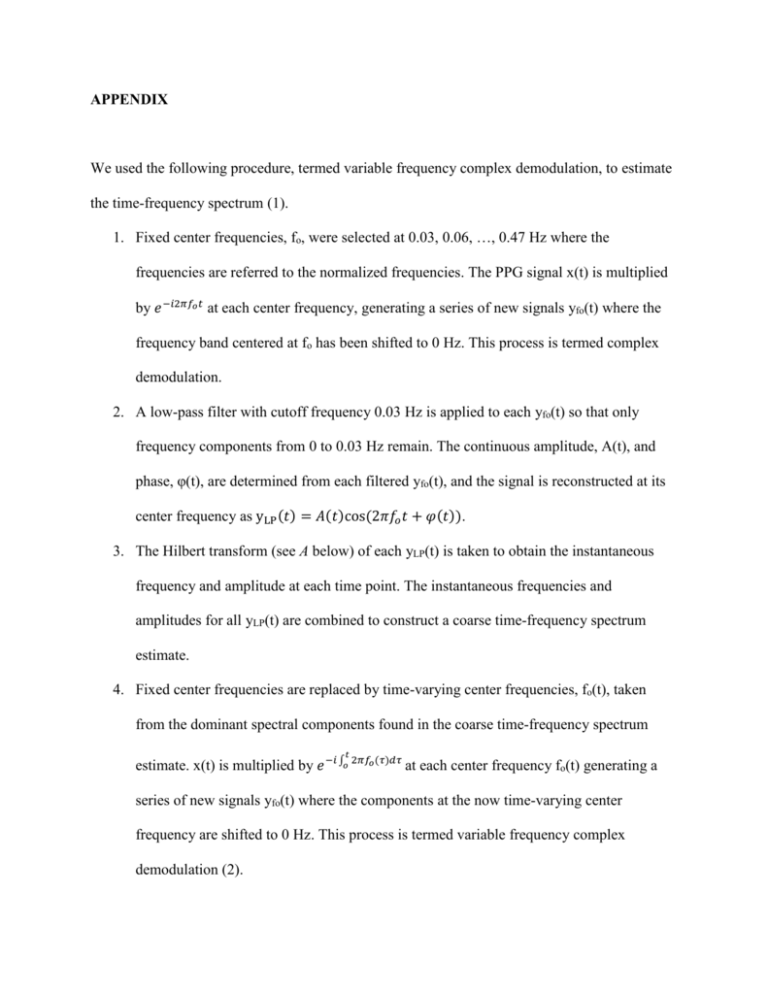
APPENDIX We used the following procedure, termed variable frequency complex demodulation, to estimate the time-frequency spectrum (1). 1. Fixed center frequencies, fo, were selected at 0.03, 0.06, …, 0.47 Hz where the frequencies are referred to the normalized frequencies. The PPG signal x(t) is multiplied by 𝑒 −𝑖2𝜋𝑓𝑜 𝑡 at each center frequency, generating a series of new signals yfo(t) where the frequency band centered at fo has been shifted to 0 Hz. This process is termed complex demodulation. 2. A low-pass filter with cutoff frequency 0.03 Hz is applied to each yfo(t) so that only frequency components from 0 to 0.03 Hz remain. The continuous amplitude, A(t), and phase, φ(t), are determined from each filtered yfo(t), and the signal is reconstructed at its center frequency as yLP (𝑡) = 𝐴(𝑡)cos(2𝜋𝑓𝑜 𝑡 + 𝜑(𝑡)). 3. The Hilbert transform (see A below) of each yLP(t) is taken to obtain the instantaneous frequency and amplitude at each time point. The instantaneous frequencies and amplitudes for all yLP(t) are combined to construct a coarse time-frequency spectrum estimate. 4. Fixed center frequencies are replaced by time-varying center frequencies, fo(t), taken from the dominant spectral components found in the coarse time-frequency spectrum 𝑡 estimate. x(t) is multiplied by 𝑒 −𝑖 ∫𝑜 2𝜋𝑓𝑜 (𝜏)𝑑𝜏 at each center frequency fo(t) generating a series of new signals yfo(t) where the components at the now time-varying center frequency are shifted to 0 Hz. This process is termed variable frequency complex demodulation (2). 5. A low-pass filter with cutoff frequency 0.015 Hz is applied to each yfo(t). The continuous amplitude, A(t), and phase, φ(t), are determined from each filtered yfo(t). Each filtered signal is reconstructed at its time-varying center frequency as yLP (𝑡) = 𝑡 𝐴(𝑡)cos(∫0 2𝜋𝑓𝑜 (𝜏)𝑑𝜏 + 𝜑(𝑡)). 6. A refined time-frequency spectrum is obtained by instantaneous amplitudes and frequencies from the resultant of the Hilbert transform of each yLP(t). A. Hilbert Transform. For an arbitrary time series, X(t) (we assume that X(t) contains center frequency oscillations, i.e., fo), its Hilbert transform, Y(t), is as follows. Y (t ) [ X (t )] 1 X (t ) dt t t (1) The instantaneous amplitude A(t ) [ X 2 (t ) Y 2 (t )]1 / 2 The instantaneous phase (t ) arctan( The instantaneous frequency f (t ) Y (t ) ) X (t ) 1 d (t ) 2 dt (2) (3) (4) References 1. Wang H, Siu K, Ju K, Chon KH. A high resolution approach to estimating time- frequency spectra and their amplitudes. Ann Biomed Eng. 2006 Feb;34(2):326-38. 2. Gasquet, H. and A. J. Wootton, Variable-frequency complex demodulation technique for extracting amplitude and phase information. Review of Scientific Instruments. 1997;68:1111-4.
