PISCES Meteorological Data
advertisement
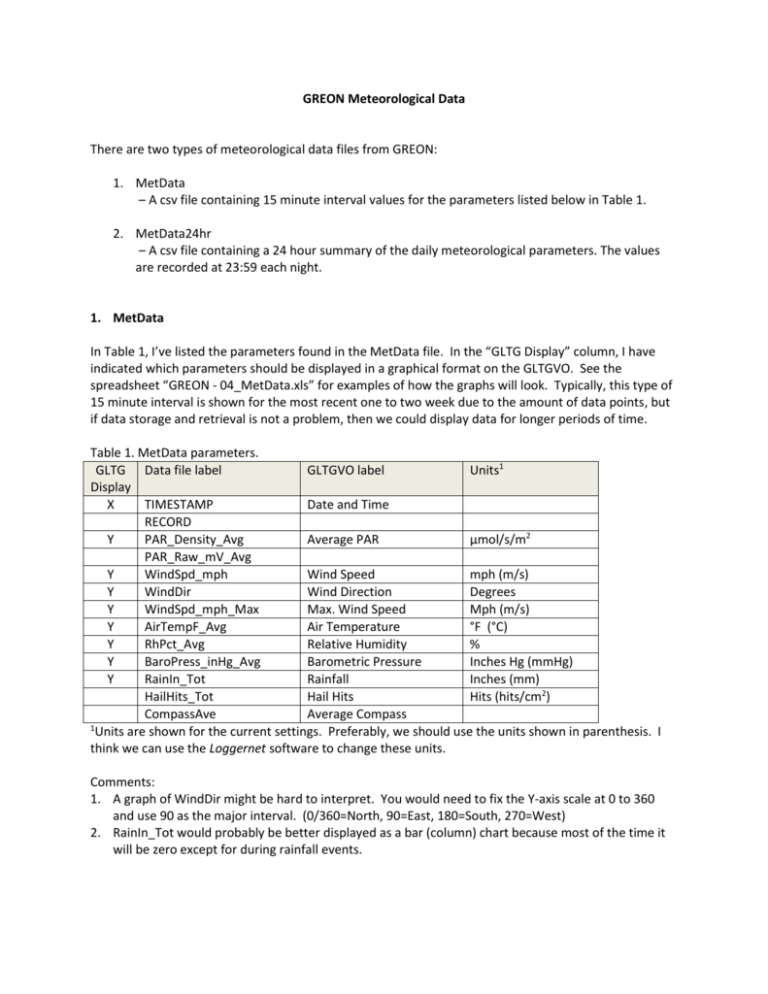
GREON Meteorological Data There are two types of meteorological data files from GREON: 1. MetData – A csv file containing 15 minute interval values for the parameters listed below in Table 1. 2. MetData24hr – A csv file containing a 24 hour summary of the daily meteorological parameters. The values are recorded at 23:59 each night. 1. MetData In Table 1, I’ve listed the parameters found in the MetData file. In the “GLTG Display” column, I have indicated which parameters should be displayed in a graphical format on the GLTGVO. See the spreadsheet “GREON - 04_MetData.xls” for examples of how the graphs will look. Typically, this type of 15 minute interval is shown for the most recent one to two week due to the amount of data points, but if data storage and retrieval is not a problem, then we could display data for longer periods of time. Table 1. MetData parameters. GLTG Data file label GLTGVO label Units1 Display X TIMESTAMP Date and Time RECORD Y PAR_Density_Avg Average PAR µmol/s/m2 PAR_Raw_mV_Avg Y WindSpd_mph Wind Speed mph (m/s) Y WindDir Wind Direction Degrees Y WindSpd_mph_Max Max. Wind Speed Mph (m/s) Y AirTempF_Avg Air Temperature °F (°C) Y RhPct_Avg Relative Humidity % Y BaroPress_inHg_Avg Barometric Pressure Inches Hg (mmHg) Y RainIn_Tot Rainfall Inches (mm) HailHits_Tot Hail Hits Hits (hits/cm2) CompassAve Average Compass 1 Units are shown for the current settings. Preferably, we should use the units shown in parenthesis. I think we can use the Loggernet software to change these units. Comments: 1. A graph of WindDir might be hard to interpret. You would need to fix the Y-axis scale at 0 to 360 and use 90 as the major interval. (0/360=North, 90=East, 180=South, 270=West) 2. RainIn_Tot would probably be better displayed as a bar (column) chart because most of the time it will be zero except for during rainfall events. 2. MetData24hr Table 2 is a list of all the parameters found in the MetData24hr file. In the “GLTG Display” column, I have indicated which parameters should be included in a table display on the GLTGVO. Table 3 is an example of the type of table we could show on the GLTGVO. We could remove some parameters from Table 3 if we feel there is too much to display. For example, for temperature, relative humidity, and barometric pressure, it would probably be sufficient to show only the Max and Min values (i.e., not the average). You can also see this table on the “Formatted” tab in the “GREON – 02_MetData24hr.xls” file. Table 2. Twenty-four hour summary of meteorological data. GLTG Parameter Display X TIMESTAMP RECORD X PAR_DailyTotal_Tot X WindSpd_mph X WindDir X WindSpd_mph_Max X AirTempF_Avg X AirTempF_Max X AirTempF_Min X RhPct_Avg X RhPct_Max X RhPct_Min X BaroPress_inHg_Avg X BaroPress_inHg_Max X BaroPress_inHg_Min X RainIn_Tot X HailHits_Tot GLTBVO label Solar Radiation Wind Speed – Avg Wind Direction Wind Speed – Max Air Temperature – Avg Air Temperature – Max Air Temperature – Min Humidity – Avg Humidity – Max Humidity – Min Pressure – Avg Pressure – Max Pressure – Min Units Table 3. Daily summary of weather data. Date 10/1/2014 Solar Radiation (mmol/m2) Wind Direction (degrees) Wind Speed (mph) Air Temperature (°F) Humidity (%) Barometric Pressure (inHg) Avg Max Avg Max Min Avg Max Min Avg Max Min Rain (in) Hail Hits (Total) 31,873 115.40 8.19 21.70 72.29 84.50 60.60 68.31 89.20 45.00 29.41 29.47 29.32 0.07 0 10/2/2014 14,832 114.00 7.16 24.20 68.82 74.60 65.80 86.30 92.10 71.60 29.35 29.45 29.20 2.86 0 10/3/2014 12,509 279.30 15.54 33.80 58.52 66.00 48.50 76.73 92.10 51.40 29.39 29.58 29.12 0.34 0 10/4/2014 34,141 265.00 12.03 31.40 47.98 54.60 43.30 62.40 82.60 40.80 29.49 29.55 29.45 0.03 0 10/5/2014 32,703 172.00 5.98 27.90 55.24 71.20 42.90 62.23 84.50 35.90 29.32 29.45 29.19 0.00 0 10/6/2014 30,323 244.30 7.02 30.70 61.42 69.80 54.60 62.23 85.90 34.20 29.26 29.34 29.21 0.09 0 10/7/2014 30,108 231.00 7.44 29.50 63.21 74.30 54.80 69.75 87.90 35.60 29.33 29.50 29.25 0.13 0 10/8/2014 33,069 277.20 3.54 12.50 60.79 71.70 49.40 67.57 90.30 32.20 29.59 29.66 29.50 0.00 0 10/9/2014 9,394 65.10 6.57 16.10 58.80 61.70 55.00 78.43 91.40 61.50 29.59 29.66 29.54 1.00 0 10/10/2014 5,613 30.22 6.42 15.60 54.54 58.40 52.10 79.67 90.30 63.10 29.61 29.67 29.56 0.30 0 10/11/2014 9,805 47.76 5.48 12.60 52.87 57.20 48.30 70.94 84.10 53.90 29.68 29.75 29.63 0.01 0 10/12/2014 5,713 118.70 6.64 13.50 55.67 60.80 50.90 84.90 92.50 71.40 29.48 29.65 29.37 0.01 0 10/13/2014 3,807 136.40 8.33 30.40 64.05 68.10 58.60 88.90 93.60 81.90 29.20 29.39 29.02 0.76 0 10/14/2014 6,757 262.00 13.43 26.00 56.48 63.10 54.50 87.20 90.50 81.00 29.09 29.23 28.99 0.02 0 10/15/2014 7,218 304.40 11.12 21.90 55.03 56.80 53.00 81.50 90.10 70.30 29.34 29.42 29.23 0.03 0 10/16/2014 30,666 172.30 4.00 13.70 62.04 71.00 50.50 65.01 90.10 35.40 29.36 29.46 29.29 0.00 0
