REPORT OF COMPLAINTS - University of Essex
advertisement
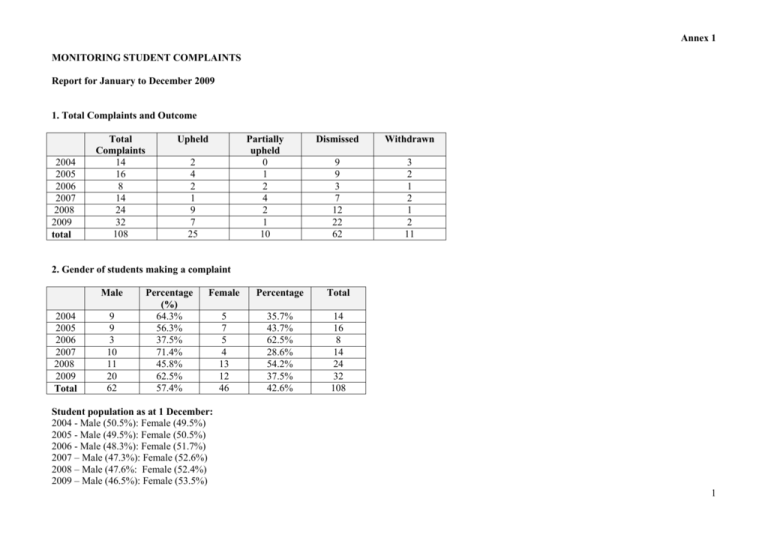
Annex 1 MONITORING STUDENT COMPLAINTS Report for January to December 2009 1. Total Complaints and Outcome 2004 2005 2006 2007 2008 2009 total Total Complaints 14 16 8 14 24 32 108 Upheld Partially upheld 0 1 2 4 2 1 10 2 4 2 1 9 7 25 Dismissed Withdrawn 9 9 3 7 12 22 62 3 2 1 2 1 2 11 2. Gender of students making a complaint Male 2004 2005 2006 2007 2008 2009 Total 9 9 3 10 11 20 62 Percentage (%) 64.3% 56.3% 37.5% 71.4% 45.8% 62.5% 57.4% Female Percentage Total 5 7 5 4 13 12 46 35.7% 43.7% 62.5% 28.6% 54.2% 37.5% 42.6% 14 16 8 14 24 32 108 Student population as at 1 December: 2004 - Male (50.5%): Female (49.5%) 2005 - Male (49.5%): Female (50.5%) 2006 - Male (48.3%): Female (51.7%) 2007 – Male (47.3%): Female (52.6%) 2008 – Male (47.6%: Female (52.4%) 2009 – Male (46.5%): Female (53.5%) 1 Annex 1 3. Students with disabilities making a complaint Number of Males making complaint Number of Females making a complaint 2004 9 5 2005 9 7 2006 3 5 2007 10 4 2008 11 13 2009 20 12 62 46 Total SWD = students with disabilities Total complaints Male SWD making a complaint Female SWD making a complaint Total complaints by SWD Percentage SWD Percentage of student population with a disability as at 1 December for each year 14 16 8 14 24 32 108 1 1 0 0 2 2 6 1 1 0 0 0 0 2 2 2 0 0 2 2 8 14.3% 12.5% 0% 0% 8.3% 9.1% 7.4% 6.87% 7.60% 7.60% 6.78% 6.61% 6.16% 4. Ethnic Origin of students making a complaint Ethnicity 2004 2005 2006 2007 2008 Total 20042008 % total complainants for 2004-2008 White Black Caribbean Black African Other Black Indian Pakistani Bangladeshi Chinese Other Asian Other Not known/Info refused TOTAL 10 1 9 3 3 10 3 1 2 1 35 1 6 1 46% 1.3% 7.8% 1.3% 1 1 1 14 2 1 4 2 10 1 2 1 7 16 8 14 24 3 4 2 24 4% 5.1% 2.5% 32% % of Student population as at 1 Dec. 2008 54.4% 1.2% 6.8% 0.6% 3.6% 1.4% 0.5% 8.9% 4.1% 6.1% 12.50% 76 100% 100% 2009 Total 20042009 % total complainants for 2004-2009 % of Student population as at 1 December 2009 17 1 2 1 52 2 8 1 1 2 4 3 2 5 8 5 26 48.5% 1.85% 7.40% 0.93% 0.93% 0 0 4.63% 7.4% 4.63% 24.07% 56.5% 1.3% 7.8% 0.6% 3.7% 1.4% 0.5% 9.4% 4.7% 5.8% 8.2% 32 108 100% 100% 2 Annex 1 Partner Colleges Complaints that have been escalated to the University after the institution’s internal complaints procedures have been exhausted. Partner College Colchester Institute Kaplan Open Learning South Essex College Tavistock and Portman Trust Writtle College Number of complaints 1 0 1 0 2 Gender of complainant Male Female Outcome Upheld Partially upheld 1 Dismissed 1 1 1 2 1 1 Dr Wayne Campbell Academic Registrar January 2011 3
