TEST Review Answers
advertisement
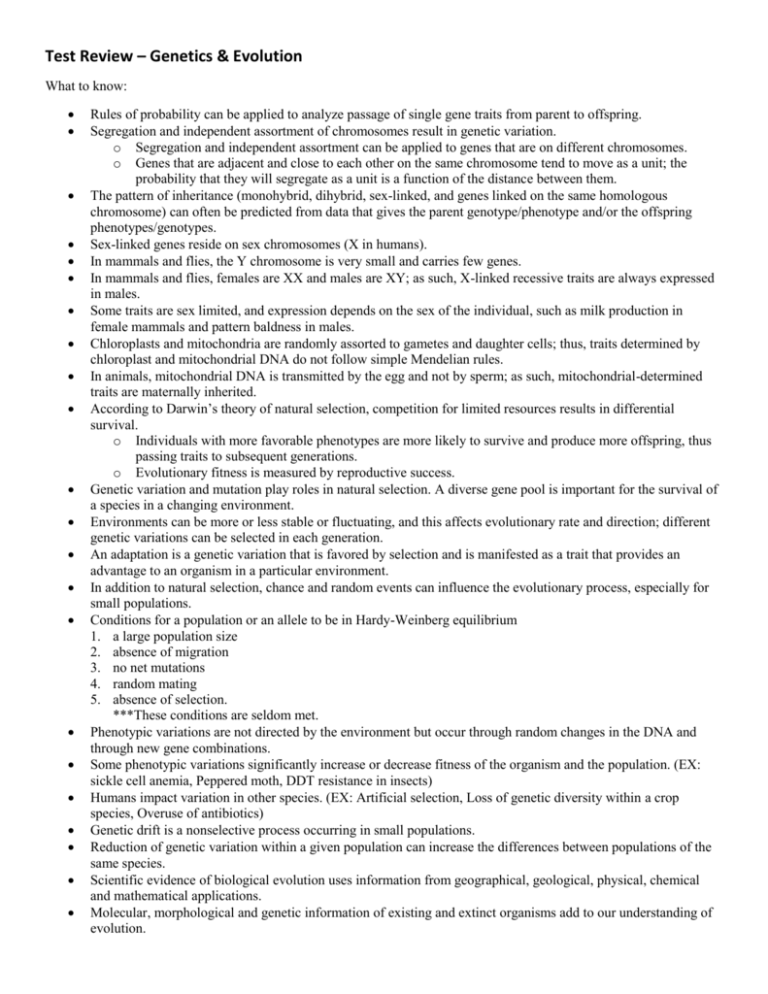
Test Review – Genetics & Evolution What to know: Rules of probability can be applied to analyze passage of single gene traits from parent to offspring. Segregation and independent assortment of chromosomes result in genetic variation. o Segregation and independent assortment can be applied to genes that are on different chromosomes. o Genes that are adjacent and close to each other on the same chromosome tend to move as a unit; the probability that they will segregate as a unit is a function of the distance between them. The pattern of inheritance (monohybrid, dihybrid, sex-linked, and genes linked on the same homologous chromosome) can often be predicted from data that gives the parent genotype/phenotype and/or the offspring phenotypes/genotypes. Sex-linked genes reside on sex chromosomes (X in humans). In mammals and flies, the Y chromosome is very small and carries few genes. In mammals and flies, females are XX and males are XY; as such, X-linked recessive traits are always expressed in males. Some traits are sex limited, and expression depends on the sex of the individual, such as milk production in female mammals and pattern baldness in males. Chloroplasts and mitochondria are randomly assorted to gametes and daughter cells; thus, traits determined by chloroplast and mitochondrial DNA do not follow simple Mendelian rules. In animals, mitochondrial DNA is transmitted by the egg and not by sperm; as such, mitochondrial-determined traits are maternally inherited. According to Darwin’s theory of natural selection, competition for limited resources results in differential survival. o Individuals with more favorable phenotypes are more likely to survive and produce more offspring, thus passing traits to subsequent generations. o Evolutionary fitness is measured by reproductive success. Genetic variation and mutation play roles in natural selection. A diverse gene pool is important for the survival of a species in a changing environment. Environments can be more or less stable or fluctuating, and this affects evolutionary rate and direction; different genetic variations can be selected in each generation. An adaptation is a genetic variation that is favored by selection and is manifested as a trait that provides an advantage to an organism in a particular environment. In addition to natural selection, chance and random events can influence the evolutionary process, especially for small populations. Conditions for a population or an allele to be in Hardy-Weinberg equilibrium 1. a large population size 2. absence of migration 3. no net mutations 4. random mating 5. absence of selection. ***These conditions are seldom met. Phenotypic variations are not directed by the environment but occur through random changes in the DNA and through new gene combinations. Some phenotypic variations significantly increase or decrease fitness of the organism and the population. (EX: sickle cell anemia, Peppered moth, DDT resistance in insects) Humans impact variation in other species. (EX: Artificial selection, Loss of genetic diversity within a crop species, Overuse of antibiotics) Genetic drift is a nonselective process occurring in small populations. Reduction of genetic variation within a given population can increase the differences between populations of the same species. Scientific evidence of biological evolution uses information from geographical, geological, physical, chemical and mathematical applications. Molecular, morphological and genetic information of existing and extinct organisms add to our understanding of evolution. Evidences of evolution: 1. Fossils can be dated by a variety of methods that provide evidence for evolution. These include the age of the rocks where a fossil is found, the rate of decay of isotopes including carbon-14, the relationships within phylogenetic trees, and the mathematical calculations that take into account information from chemical properties and/or geographical data. ✘The details of these methods are beyond the scope of this course and the AP Exam. 2. Morphological homologies represent features shared by common ancestry. Vestigial structures are remnants of functional structures, which can be compared to fossils and provide evidence for evolution. 3. Biochemical and genetic similarities, in particular DNA nucleotide and protein sequences, provide evidence for evolution and ancestry. 4. Mathematical models and simulations can be used to illustrate and support evolutionary concepts. (Examples: Graphical analyses of allele frequencies in a population, Analysis of sequence data sets, Analysis of phylogenetic trees, Construction of phylogenetic trees based on sequence data) Phylogenetic trees and cladograms can represent traits that are either derived or lost due to evolution. Phylogenetic trees and cladograms illustrate speciation that has occurred, in that relatedness of any two groups on the tree is shown by how recently two groups had a common ancestor. Phylogenetic trees and cladograms can be constructed from morphological similarities of living or fossil species, and from DNA and protein sequence similarities, by employing computer programs that have sophisticated ways of measuring and representing relatedness among organisms. Phylogenetic trees and cladograms are dynamic (i.e., phylogenetic trees and cladograms are constantly being revised), based on the biological data used, new mathematical and computational ideas, and current and emerging knowledge. Speciation rates can vary, especially when adaptive radiation occurs when new habitats become available. Species extinction rates are rapid at times of ecological stress. Speciation results in diversity of life forms. Species can be physically separated by a geographic barrier such as an ocean or a mountain range, or various pre-and post-zygotic mechanisms can maintain reproductive isolation and prevent gene flow. New species arise from reproductive isolation over time, which can involve scales of hundreds of thousands or even millions of years, or speciation can occur rapidly through mechanisms such as polyploidy in plants. Scientific evidence supports the idea that evolution has occurred in all species. Scientific evidence supports the idea that evolution continues to occur.[EX: Chemical resistance (mutations for resistance to antibiotics, pesticides, herbicides or chemotherapy drugs occur in the absence of the chemical) Emergent diseases] Observed directional phenotypic change in a population (Grants’ observations of Darwin’s finches in the Galapagos) A eukaryotic example that describes evolution of a structure or process such as heart chambers, limbs, the brain and the immune system There are several hypotheses about the natural origin of Earth: o Primitive Earth provided inorganic precursors from which organic molecules could have been synthesized due to the presence of available free energy and the absence of a significant quantity of oxygen. o In turn, these molecules served as monomers or building blocks for the formation of more complex molecules, including amino acids and nucleotides. o The joining of these monomers produced polymers with the ability to replicate, store and transfer information. o These complex reaction sets could have occurred in solution (organic soup model) or as reactions on solid reactive surfaces. o The RNA World hypothesis proposes that RNA could have been the earliest genetic material. The Earth formed approximately 4.6 billion years ago (bya), and the environment was too hostile for life until 3.9 bya, while the earliest fossil evidence for life dates to 3.5 bya. Taken together, this evidence provides a plausible range of dates when the origin of life could have occurred. Chemical experiments have shown that it is possible to form complex organic molecules from inorganic molecules in the absence of life. Molecular and genetic evidence from extant and extinct organisms indicates that all organisms on Earth share a common ancestral origin of life. Scientific evidence includes molecular building blocks that are common to all life forms. Scientific evidence includes a common genetic code. Practice Questions (Actual AP Test Questions) 1. A scientist used the amino acid sequence of cytochrome c in different species to consider evolutionary relationships. The data below summarize the number of differences in the amino acid sequences of cytochrome c found in selected species. Interpretation of the data supports which of the following statements? (A) Rhesus monkeys are more closely related to rabbits than they are to horses. (B) Horses and cows have identical amino acid sequences in their cytochrome c. (C) Humans are more closely related to rabbits than they are to rhesus monkeys. (D) Plants and animals have no similarities at all. (E) Mammals are more closely related to reptiles than they are to fish. 2. Which of the following phylogenetic trees can be supported by the data? (A) I only (B) II only (C) III only (D) I and II only (E) I, II, and III A biologist spent many years researching the rate of evolutionary change in the finch populations of a group of islands. It was determined that the average beak size (both length and mass) of finches in a certain population increased dramatically during an intense drought between 1981 and 1987. During the drought, there was a reduction in the number of plants producing thin-walled seeds. 3. Which of the following procedures was most likely followed to determine the change in beak size? (A) A few finches were trapped in 1981 and again in 1987, and their beak sizes were compared. (B) The beak size in fifteen finches was measured in 1987, and the beak size in the original finches was determined by estimation. (C) The beak size in a large number of finches was measured every year from 1981 to 1987. (D) Finches were captured and bred in 1981, and the beak size of the offspring was measured. 4. Which of the following statements might best explain the increase in average beak size in the finch population during the drought? (A) Finches with bigger beaks are better able to crack thick-walled seeds and produce more surviving offspring. (B) Finches with bigger beaks can attack and kill finches with smaller beaks. (C) Finches with bigger beaks possess more powerful flight muscles and are able to find more food. (D) Finches that crack large seeds develop larger beaks over time. 5. Which of the following best describes the mechanism behind the change in beak size in the finch population? (A) The formation of two new finch species from a single parent species (B) A change in gene frequencies in the finch population due to selective pressure from the environmental change (C) A new allele appearing in the finch population as a result of mutation (D) The achievement of dynamic equilibrium in the finch population as a result of homeostasis 6. Some people have the ability to taste a bitter chemical called phenylthiocarbamide (PTC). The ability to taste PTC is due to the presence of at least one dominant allele for the PTC taste gene. The incidence of nontasters in North America is approximately 45%. Assuming the population is in Hardy-Weinberg equilibrium, what percent of the North American population is homozygous dominant for the ability to taste PTC? Provide your answer as a number between 0 and 1 to the nearest hundredth. Any value from 0.09 to 0.11, inclusive, or any value from 9/100 to 11/100, inclusive 7. In a certain species of flowering plant, the purple allele P is dominant to the yellow allele p. A student performed a cross between a purple flowered plant and a yellow-flowered plant. When planted, the 146 seeds that were produced from the cross matured into 87 plants with purple flowers and 59 plants with yellow flowers. Calculate the chi-squared value for the null hypothesis that the purple-flowered parent was heterozygous for the flower-color gene. Give your answer to the nearest tenth. 5.3–5.4 8. In a hypothetical population of beetles, there is a wide variety of color, matching the range of coloration of the tree trunks on which the beetles hide from predators. The graphs below illustrate four possible changes to the beetle population as a result of a change in the environment due to pollution that darkened the tree trunks. Which of the following includes the most likely change in the coloration of the beetle population after pollution and a correct rationale for the change? (A) The coloration range shifted toward more light-colored beetles, as in diagram I. The pollution helped the predators find the darkened tree trunks. (B) The coloration in the population split into two extremes, as in diagram II. Both the lighter-colored and the darker-colored beetles were able to hide on the darker tree trunks. (C) The coloration range became narrower, as in diagram III. The predators selected beetles at the color extremes. (D) The coloration in the population shifted toward more darker-colored beetles, as in diagram IV. The lighter colored beetles were found more easily by the predators than were the darker-colored beetles. 9. A group of mice was released into a large field to which no other mice had access. Immediately after the release, a representative sample of the mice was captured, and the fur color of each individual in the sample was observed and recorded. The mice were then returned to the field. After twenty years, another representative sample of the mice was captured, and the fur color of each individual in the sample was again recorded. Which of the following best explains the change in the frequency distribution of fur color phenotypes in the mouse population, as shown in the figures above? (A) The allele for gray fur color is unstable, and over twenty years most of those alleles mutated to become alleles for black fur. (B) The field was composed primarily of light-colored soil and little vegetation, affording gray mice protection from predators. (C) Sexual selection led to increased mating frequency of black and brown versus gray and brown. (D) The gray mice were hardest to capture and so were underrepresented in the twenty-year sample. 10. To determine the evolutionary history and relationships among organisms, scientists gather evidence from a wide variety of sources including paleontology, embryology, morphology, behavior, and molecular biology. A phylogenetic tree of vertebrates is shown. Which of the following statements is most consistent with the phylogenetic tree shown? (A) Birds and turtles evolved their own means of gas exchange independently of the other vertebrates. (B) Mammals are most closely related to birds because they share a direct common ancestor. (C) The common ancestor of reptiles, birds, and mammals produced amniotic eggs. (D) Crocodiles are direct descendants of ray-finned fishes since they live in the same environment. 11. Ellis-van Creveld syndrome is a recessive genetic disorder that includes the characteristics of short stature and extra fingers or toes. In the general population, this syndrome occurs in approximately 1 in 150,000 live births. In a particular isolated population, however, the incidence of this syndrome among live births is 1 in 500. Assume that both the isolated population and the general population are in Hardy-Weinberg equilibrium with respect to this syndrome. Which of the following best describes the difference between the frequency of the allele that causes the syndrome in the general population and the frequency of the allele in the isolated population? (A) The frequency of the Ellis-van Creveld allele is 0.002 in the isolated population and 0.0000066 in the general population, which suggests that selection for this trait is occurring in both populations. (B) The frequency of the Ellis-van Creveld allele is 0.0447 in the isolated population and 0.0026 in the general population, showing that the rate of genetic mutation is highest among individuals in the isolated population. (C) The frequency of the Ellis-van Creveld allel is 0.002 in the isolated population and 0.0000066 in the general population, which demonstrates gametic incompatibility between the populations. (D) The frequency of the Ellis-van Creveld allele is 0.0447 in the isolated population and 0.0026 in the general population, which suggests that genetic drift has occurred in the isolated population.
