Unit 10: Analyzing Data Sets for Two Categorical Variables
Learning Targets Name: _______________________________________________ Block: ______
Unit 10: Analyzing Data Sets for Two Categorical Variables
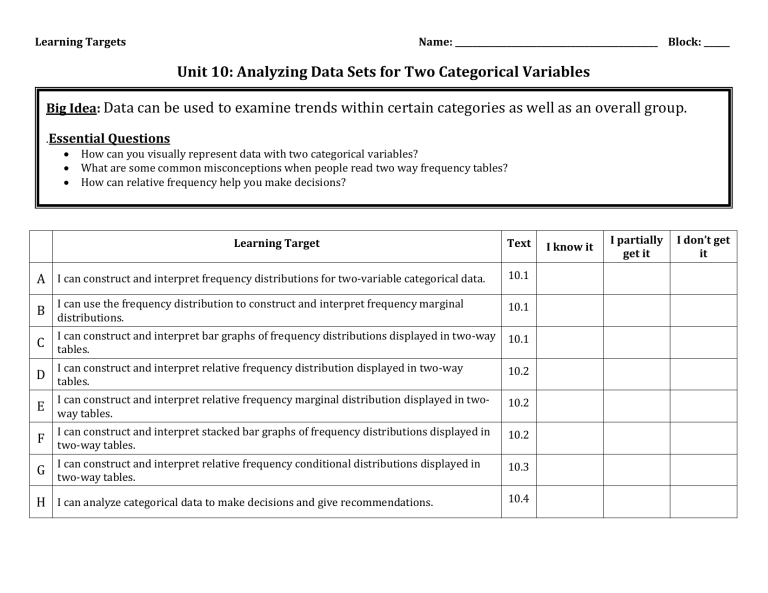
Big Idea: Data can be used to examine trends within certain categories as well as an overall group.
.
Essential Questions
How can you visually represent data with two categorical variables?
What are some common misconceptions when people read two way frequency tables?
How can relative frequency help you make decisions?
Learning Target
A I can construct and interpret frequency distributions for two-variable categorical data.
10.1
B
C
D
E
F
G
I can use the frequency distribution to construct and interpret frequency marginal distributions.
I can construct and interpret bar graphs of frequency distributions displayed in two-way tables.
I can construct and interpret relative frequency distribution displayed in two-way tables.
I can construct and interpret relative frequency marginal distribution displayed in twoway tables.
I can construct and interpret stacked bar graphs of frequency distributions displayed in two-way tables.
I can construct and interpret relative frequency conditional distributions displayed in two-way tables.
10.1
10.1
10.2
10.2
10.2
10.3
10.4 H I can analyze categorical data to make decisions and give recommendations.
I don’t get it
Learning Targets
= Complete inc = incomplete
Name: _______________________________________________ Block: ______
Assignment
Students must return this form with a parent signature within two days of receiving test results to retake the test.
Need more practice with…
Quiz # Score Need more practice with…
Unit 10 Homework Grade: _______ / _______
Unit 10 Test Grade: _______ / __50__
Overall Course Grade: _______ % Teacher Initials ________
Parent Signature: _____________________________________________
Retake Test Grade: _______ %
