04 CCM7 Unit 5 PARCC info
advertisement
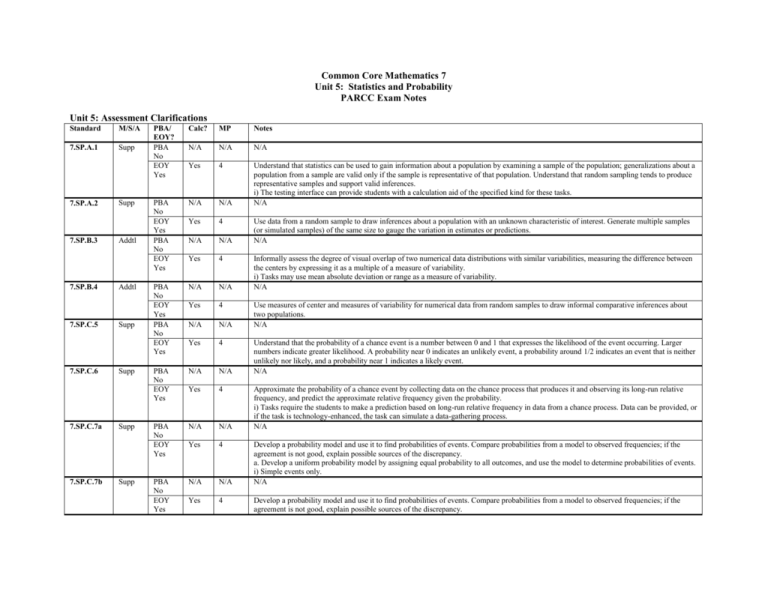
Common Core Mathematics 7 Unit 5: Statistics and Probability PARCC Exam Notes Unit 5: Assessment Clarifications Standard M/S/A 7.SP.A.1 Supp 7.SP.A.2 7.SP.B.3 7.SP.B.4 7.SP.C.5 7.SP.C.6 7.SP.C.7a 7.SP.C.7b Supp Addtl Addtl Supp Supp Supp Supp PBA/ EOY? PBA No EOY Yes Calc? MP Notes N/A N/A N/A Yes 4 PBA No EOY Yes PBA No EOY Yes N/A N/A Understand that statistics can be used to gain information about a population by examining a sample of the population; generalizations about a population from a sample are valid only if the sample is representative of that population. Understand that random sampling tends to produce representative samples and support valid inferences. i) The testing interface can provide students with a calculation aid of the specified kind for these tasks. N/A Yes 4 N/A N/A Yes 4 PBA No EOY Yes PBA No EOY Yes N/A N/A Yes 4 N/A N/A Yes 4 PBA No EOY Yes N/A N/A Yes 4 PBA No EOY Yes N/A N/A Yes 4 PBA No EOY Yes N/A N/A Yes 4 Use data from a random sample to draw inferences about a population with an unknown characteristic of interest. Generate multiple samples (or simulated samples) of the same size to gauge the variation in estimates or predictions. N/A Informally assess the degree of visual overlap of two numerical data distributions with similar variabilities, measuring the difference between the centers by expressing it as a multiple of a measure of variability. i) Tasks may use mean absolute deviation or range as a measure of variability. N/A Use measures of center and measures of variability for numerical data from random samples to draw informal comparative inferences about two populations. N/A Understand that the probability of a chance event is a number between 0 and 1 that expresses the likelihood of the event occurring. Larger numbers indicate greater likelihood. A probability near 0 indicates an unlikely event, a probability around 1/2 indicates an event that is neither unlikely nor likely, and a probability near 1 indicates a likely event. N/A Approximate the probability of a chance event by collecting data on the chance process that produces it and observing its long-run relative frequency, and predict the approximate relative frequency given the probability. i) Tasks require the students to make a prediction based on long-run relative frequency in data from a chance process. Data can be provided, or if the task is technology-enhanced, the task can simulate a data-gathering process. N/A Develop a probability model and use it to find probabilities of events. Compare probabilities from a model to observed frequencies; if the agreement is not good, explain possible sources of the discrepancy. a. Develop a uniform probability model by assigning equal probability to all outcomes, and use the model to determine probabilities of events. i) Simple events only. N/A Develop a probability model and use it to find probabilities of events. Compare probabilities from a model to observed frequencies; if the agreement is not good, explain possible sources of the discrepancy. 7.SP.C.8a 7.SP.C.8b 7.SP.C.8c Supp Supp Supp PBA No EOY Yes N/A N/A Yes 4, 5 PBA No EOY Yes N/A N/A Yes 4, 5 PBA No EOY Yes N/A N/A Yes 4, 5 b. Develop a probability model (which may not be uniform) by observing frequencies in data generated from a chance process. i) Data can be provided, or if the task is technology-enhanced, the task can simulate a data-gathering process. N/A Find probabilities of compound events using organized lists, tables, tree diagrams, and simulation. a. Understand that, just as with simple events, the probability of a compound event is the fraction of outcomes in the sample space for which the compound event occurs. N/A Find probabilities of compound events using organized lists, tables, tree diagrams, and simulation. b. Represent sample spaces for compound events using methods such as organized lists, tables and tree diagrams. For an event described in everyday language (e.g., “rolling double sixes”), identify the outcomes in the sample space which compose the event. N/A Find the probabilities of compound events using organized lists, tables, tree diagrams, and simulation. c. Design and use a simulation to generate frequencies for compound events. Other Integrative Tasks may be linked to Unit 5 Evidence Statement Reach Back? PBA/ EOY? Calc? MP Notes 7.D.1 N/A PBA Yes 4, 1, 2, 5, 7 7.D.3 N/A PBA Yes 4, 1, 2, 5, 7 7.D.4 N/A PBA Yes 4, 1, 2, 5, 7 Solve multi-step contextual word problems with degree of difficulty appropriate to grade 7, requiring application of the grade 7 knowledge and skills articulated in the Evidence Statements on the PBA (excludes the Reasoning Evidence Statements which are those that start with 7.C). Tasks may have scaffolding if necessary in order to yield a degree of difficulty appropriate to grade 7. Micro-models: Autonomously apply a technique from pure mathematics to a real-world situation in which the technique yields valuable results even though it is obviously not applicable in a strict mathematical sense (e.g., profitably applying proportional relationships to a phenomenon that is obviously nonlinear or statistical in nature). Content Scope: Grade 7 knowledge and skills articulated in the Evidence Statements on the PBA (excludes the Reasoning Evidence Statements which are those that start with 7.C). Tasks may have scaffolding if necessary in order to yield a degree of difficulty appropriate to grade 7. Reasoned estimates: Use reasonable estimates of known quantities in a chain of reasoning that yields an estimate of an unknown quantity. Content Scope: Grade 7 knowledge and skills articulated in the Evidence Statements on the PBA (excludes the Reasoning Evidence Statements which are those that start with 7.C). Tasks may have scaffolding if necessary in order to yield a degree of difficulty appropriate to grade 7. PARCC Abbreviation Key: PBA: Performance-Based Assessment EOY: End of Year Assessment M/S/A: Indicates whether this standard is considered Major content, Supporting Content, or Additional Content MP: Standards for Mathematical Practice * Indicates a modeling standard Grade 7 Sub-Claim B Performance Level Descriptors applicable to Unit 5 Random Sampling and Comparative Inferences 7.SP.1 7.SP.2 7.SP.3 7.SP.4 Chance Processes and Probability Models 7.SP.5 7.SP.6 7.SP.7a 7.SP.7b 7.SP.8a 7.SP.8b 7.SP.8c Grade 7 Math: Sub-Claim B The student solves problems involving the Additional and Supporting Content for grade/course with connections to the Standards for Mathematical Practice. Level 5: Distinguished Command Level 4: Strong Command Level 3: Moderate Command Level 2: Partial Command Understands and uses random sampling Understands and uses random sampling Understands and uses random sampling Draws inferences about a population to draw inferences about a population. to draw inferences about a population. to draw inferences about a population. from a table or graph of random samples. Draws relevant informal comparative Draws relevant informal comparative Draws relevant informal comparative inferences about two populations, inferences about two populations, inferences about two populations. Draws simple informal comparative including assessing the degree of visual including assessing the degree of visual inferences about two populations. overlap of two numerical data overlap of two numerical data distributions with similar variabilities. distributions with similar variabilities. Generates multiple samples of the same size to gauge the variation in estimates or predictions. Generates multiple samples of the same size to gauge the variation in estimates or predictions. Analyzes whether a sample is representative of a population. Understands that the probability of a chance event is a number between 0 and 1 that expresses the likelihood of the event occurring. Understands that the probability of a chance event is a number between 0 and 1 that expresses the likelihood of the event occurring. Understands that the probability of a chance event is a number between 0 and 1 that expresses the likelihood of the event occurring. Understands that the probability of a chance event is a number between 0 and 1 that expresses the likelihood of the event occurring. Generates a sample space to determine the probability of simple or compound events using methods such as organized lists, tables, tree diagrams or simulations. Generates a sample space to determine the probability of simple or compound events using methods such as organized lists, tables, tree diagrams or simulations. Finds probabilities when given sample spaces for simple and compound events using methods such as organized lists, tables and tree diagrams. Finds probabilities when given sample spaces for simple events using methods such as organized lists and tables. Develops a model to approximate the probability of a chance event, predicts approximate frequencies when given the probability or by observing frequencies in data generated from the process, and compares probabilities from a model to observed frequencies. Develops a model to approximate the probability of a chance event and predicts approximate frequencies when given the probability or by observing frequencies in data generated from the process. Designs and uses a simulation to estimate the probability of a compound event. Uses a simulation to estimate the probability of a compound event. PARCC Sub-Claims: Sub-Claim A: Information on how PARCC will assess major content Sub-Claim B: Information on how PARCC will assess additional and supporting content Sub-Claim C: Information on how PARCC will assess reasoning Sub-Claim D: Information on how PARCC will assess modeling Develops a model to approximate the probability of a chance event and predicts approximate frequencies when given the probability or by observing frequencies in data generated from the process.
