Initial Programs Alumni Survey Results
advertisement
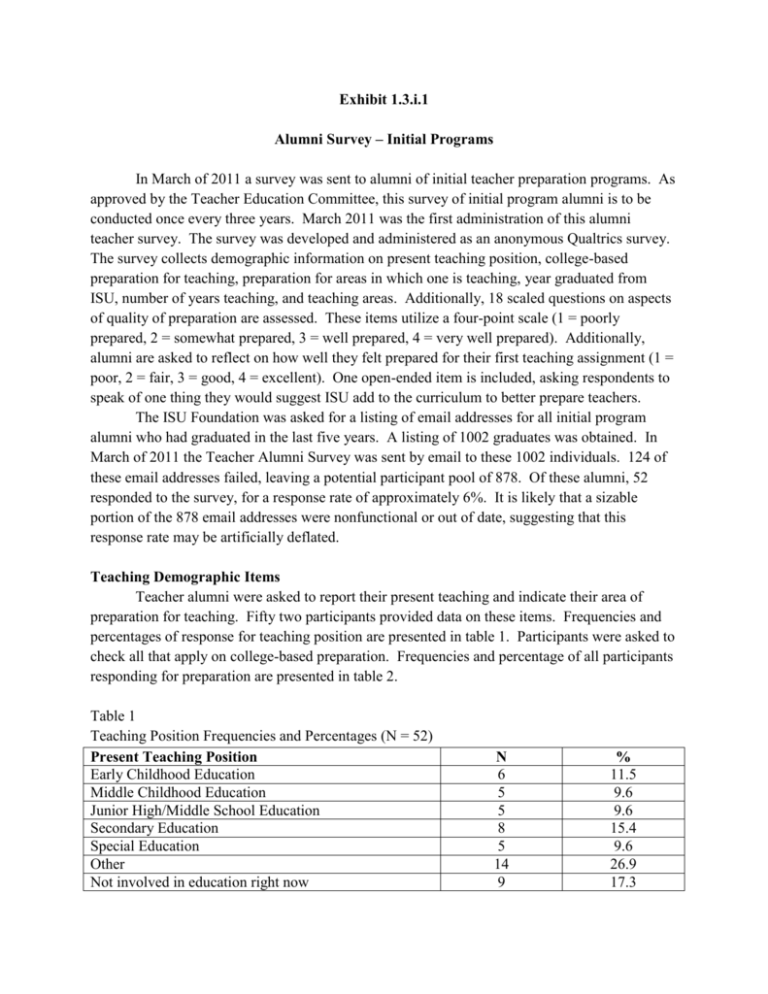
Exhibit 1.3.i.1 Alumni Survey – Initial Programs In March of 2011 a survey was sent to alumni of initial teacher preparation programs. As approved by the Teacher Education Committee, this survey of initial program alumni is to be conducted once every three years. March 2011 was the first administration of this alumni teacher survey. The survey was developed and administered as an anonymous Qualtrics survey. The survey collects demographic information on present teaching position, college-based preparation for teaching, preparation for areas in which one is teaching, year graduated from ISU, number of years teaching, and teaching areas. Additionally, 18 scaled questions on aspects of quality of preparation are assessed. These items utilize a four-point scale (1 = poorly prepared, 2 = somewhat prepared, 3 = well prepared, 4 = very well prepared). Additionally, alumni are asked to reflect on how well they felt prepared for their first teaching assignment (1 = poor, 2 = fair, 3 = good, 4 = excellent). One open-ended item is included, asking respondents to speak of one thing they would suggest ISU add to the curriculum to better prepare teachers. The ISU Foundation was asked for a listing of email addresses for all initial program alumni who had graduated in the last five years. A listing of 1002 graduates was obtained. In March of 2011 the Teacher Alumni Survey was sent by email to these 1002 individuals. 124 of these email addresses failed, leaving a potential participant pool of 878. Of these alumni, 52 responded to the survey, for a response rate of approximately 6%. It is likely that a sizable portion of the 878 email addresses were nonfunctional or out of date, suggesting that this response rate may be artificially deflated. Teaching Demographic Items Teacher alumni were asked to report their present teaching and indicate their area of preparation for teaching. Fifty two participants provided data on these items. Frequencies and percentages of response for teaching position are presented in table 1. Participants were asked to check all that apply on college-based preparation. Frequencies and percentage of all participants responding for preparation are presented in table 2. Table 1 Teaching Position Frequencies and Percentages (N = 52) Present Teaching Position Early Childhood Education Middle Childhood Education Junior High/Middle School Education Secondary Education Special Education Other Not involved in education right now N 6 5 5 8 5 14 9 % 11.5 9.6 9.6 15.4 9.6 26.9 17.3 Table 2 College-Based Preparation Frequency and Percentages (N = 52) College-based preparation for teaching Early Childhood Education Middle Childhood Education Junior High/Middle School Education Secondary Education Special Education Speech Language Pathology None of these N 16 18 22 25 8 2 5 % 30.7 34.6 42.3 48.1 15.4 3.8 9.6 For those whose teaching position fell into the “other” category, descriptions included school administration, special education classroom aid, post secondary educator, extension educator, art education, sign language interpreter, physical education and interventionist, and retired. Alumni were asked whether they were formally prepared for all areas in which they are teaching. Fifty-one participants answered this question. Forty-four alumni answered that they were formally prepared for all areas (86%) while seven (14%) answered that they were not. Alumni were also asked to list the year they had graduated from ISU. Responses indicated a potential problem with the participant email list. Many participants indicated graduating in years prior to the last five years. The majority of participant indicated graduating quite some time ago. Frequency of graduation year in backwards chronological order are 2009 = 2, 2008 = 2, 2007 = 1, 2006 = 4, 2005 = 1, 2004 = 8, 1987 = 1, 1980 = 15, 1979 = 10, 1977 = 10, and 1970 = 1. The large number of responses from 1979 and 1980 may indicate that some participants entered their year of birth rather than their year of graduation. Nonetheless, the earlier response of “retired” for current teaching position indicates that the email list may have included a mixture of graduation years, stemming beyond the five years requested. Participants were asked to provide data on how many years they had been teaching. Forty-nine participants responded to this question. The most common number of years reported were one (n = 10) and two (n = 10), followed by three (n = 7) and four (n = 7). The number of years teaching ranged from 1 to 32 (also indicative of a problem with the email list), with a mean of 5.9. Alumni were also asked about their teaching area or areas (checking all that apply). Fifty-one participants reported teaching areas. Frequencies and percentage of all participants responding for preparation are presented in table 3. Table 3 Area of Teaching Frequencies and Percentages (N = 51) Area of Teaching Art Computer Education Driver’s Education Elementary Education English Education Foreign Languages Family & Consumer Science Mathematics Education Music Education Reading Science Education Social Studies Education Special Education Business Education Health and Safety Education Physical Education Technology Education Other N 3 3 3 19 7 1 3 8 5 7 5 8 8 2 2 3 2 3 % 5.9 5.9 5.9 37.3 13.7 2.0 5.9 15.7 9.8 13.7 9.8 15.7 15.7 3.9 3.9 5.9 3.9 5.9 Preparation Received by ISU Items Alumni were asked to rate (using a four point scale from 1 = poorly prepared to 4 = very well prepared) their assessment about how well ISU prepared them for each of eighteen assessed areas. Forty-four alumni responded to these items. Response frequencies as well as means and standard deviations of each item are presented in table 4. Table 4 Response Frequencies, Means and Standard Deviations of Preparation Items (N = 44) Design units of instruction that focus on the content standards for schools in Indiana Design classroom assessments that are aligned with Indiana content standards Create meaningful learning experiences based on content knowledge Assess your own professional growth needs to develop a meaningful professional development plan Use teaching approaches that are sensitive to diverse learners Use multiple teaching strategies to encourage critical thinking Design developmentally appropriate learning tasks Work collegially with peers to improve student learning Mediate student learning to help students achieve full potential Develop productive relationships with parents or guardians to support student learning Design a learning environment to actively engage students in learning Use technology as an integral part of your instruction to support and extend student learning Use information about the community and student backgrounds to design relevant learning experiences Design and use formative assessments that give purposeful feedback to students Design and use classroom assessments that accurately assess student learning Reflect on your teaching to improve student learning Engage students in problem-based learning Serve as a respected student role model Very Well Prepared N/% Well Prepared N/% 10 22.7 23 52.3 9 20.5 10 22.7 17 38.6 15 34.1 Somewhat Poorly Prepared Prepared N/% N/% Mean SD 2 4.5 2.93 .79 15 34.1 2 4.5 2.80 .85 18 40.9 9 20.5 2 4.5 3.05 .86 8 19.0 17 40.5 13 31.0 4 9.5 2.69 .90 11 25.0 12 27.3 12 27.3 13 29.5 8 18.6 20 45.5 21 47.7 20 45.5 20 45.5 23 53.5 12 27.3 7 15.9 6 13.6 9 20.5 11 25.6 1 2.3 4 9.0 6 13.6 2 4.5 1 2.3 2.93 .79 2.93 .90 2.86 .98 3.00 .84 2.88 .73 5 11.4 19 43.2 13 29.5 7 15.9 2.50 .90 13 29.5 21 47.7 7 15.9 3 6.8 3.00 .86 11 25.0 18 40.9 12 27.3 3 6.8 2.84 .89 7 16.3 18 41.9 18 41.9 0 2.74 .73 9 20.5 24 54.5 7 15.9 4 9.0 2.86 .85 11 25.0 19 43.2 7 16.3 24 55.8 21 47.7 18 40.9 27 62.8 17 39.5 11 25.0 6 13.6 6 14.0 2 4.7 1 2.3 1 2.3 3 7.0 2.95 .78 3.25 .78 2.88 .76 3.51 .59 0 The data in table 4 indicate generally positive ratings of preparation by ISU. The midpoint of this scale is at 2.5. For all eighteen items, the mean is at or above this midpoint. Item means range from 2.50 (develop productive relationships with parents or guardians to support student learning) to 3.51 (serve as a respected student role model). Items with means at or above 3.0 reflect a high level of provided preparation by ISU. Five items meet this criteria; create meaningful learning experiences based on content knowledge (M = 3.05), work collegially with peers to improve student learning (M = 3.00), design a learning environment to actively engage students in learning (M = 3.00), reflect on your teaching to improve student learning (M = 3.25), and serve as a respected student role model (M = 3.51). Forty-four alumni responded to the question on how well, generally, they felt prepared for their first teaching assignment. Eleven responded indicated this preparation was “excellent (25.0%), twenty-five indicated preparation was “good” (56.8%), five indicated preparation was only “fair” (11.4%) and three responded that they felt their preparation was “poor” (6.8%). Open-Ended Item Finally, one open-ended question was utilized, asking participants to suggest one thing they would like to see included in the curriculum to better prepare new teachers. Thirty-five participants responded to this question. A large number of these responses were off target, speaking to the present state of education or discussing particular faculty members. However, three response themes did emerge. The largest (ten responses) theme dealt with classroom management skills. Participants indicated a need for more training in this area prior to starting a job. Many participants spoke of difficulties in working with “troubled” or “problem” students, a need for greater knowledge of disciplinary systems and behavior management skills. The second theme (eleven responses) indicated a need for more frequent field experiences. Students should be placed ‘early and often” in the classroom to practice the skills learned in class. One participant did note that with the inclusion of the Total Program at ISU, many concerns in this area have been addressed. Finally, a smaller theme (three responses) emerged around training in classroom technology, with participants suggesting increased focus in the curriculum on technological aspects of pedagogy. Other responses included more training in special education, training in interview skills, and more information on the changing laws regarding education.

