September 2014 Report Summary
advertisement
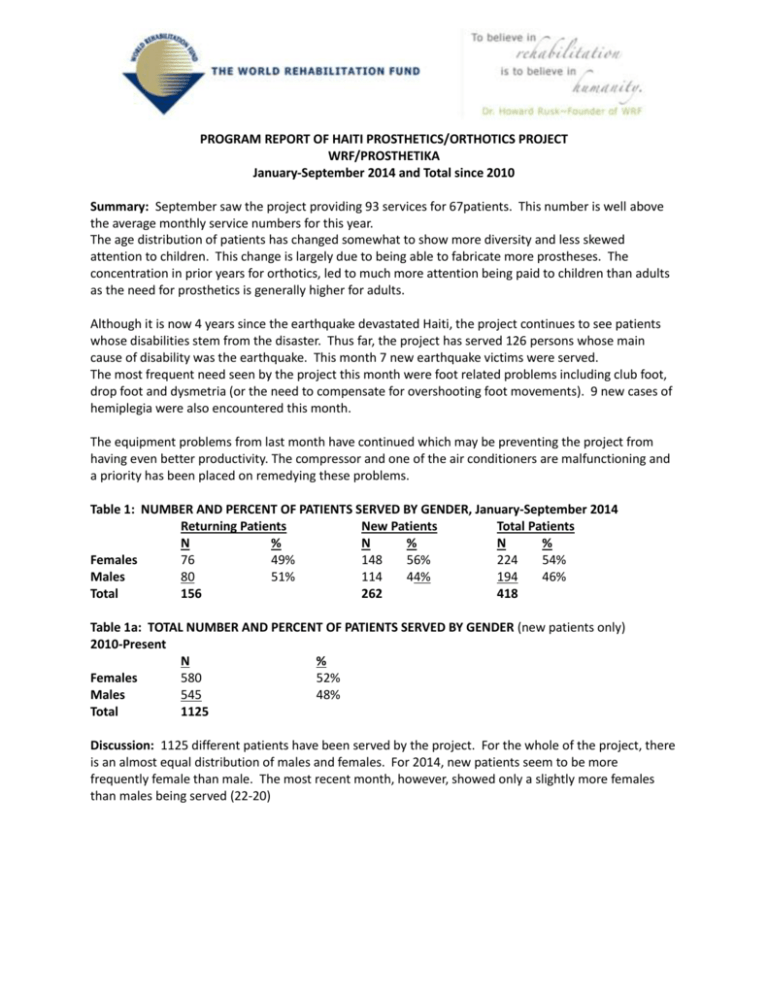
PROGRAM REPORT OF HAITI PROSTHETICS/ORTHOTICS PROJECT WRF/PROSTHETIKA January-September 2014 and Total since 2010 Summary: September saw the project providing 93 services for 67patients. This number is well above the average monthly service numbers for this year. The age distribution of patients has changed somewhat to show more diversity and less skewed attention to children. This change is largely due to being able to fabricate more prostheses. The concentration in prior years for orthotics, led to much more attention being paid to children than adults as the need for prosthetics is generally higher for adults. Although it is now 4 years since the earthquake devastated Haiti, the project continues to see patients whose disabilities stem from the disaster. Thus far, the project has served 126 persons whose main cause of disability was the earthquake. This month 7 new earthquake victims were served. The most frequent need seen by the project this month were foot related problems including club foot, drop foot and dysmetria (or the need to compensate for overshooting foot movements). 9 new cases of hemiplegia were also encountered this month. The equipment problems from last month have continued which may be preventing the project from having even better productivity. The compressor and one of the air conditioners are malfunctioning and a priority has been placed on remedying these problems. Table 1: NUMBER AND PERCENT OF PATIENTS SERVED BY GENDER, January-September 2014 Returning Patients New Patients Total Patients N % N % N % Females 76 49% 148 56% 224 54% Males 80 51% 114 44% 194 46% Total 156 262 418 Table 1a: TOTAL NUMBER AND PERCENT OF PATIENTS SERVED BY GENDER (new patients only) 2010-Present N % Females 580 52% Males 545 48% Total 1125 Discussion: 1125 different patients have been served by the project. For the whole of the project, there is an almost equal distribution of males and females. For 2014, new patients seem to be more frequently female than male. The most recent month, however, showed only a slightly more females than males being served (22-20) Table II: NUMBER AND PERCENT OF PERSONS SERVED BY AGE GROUP, January-September 2014 Returning Patients New Patients Total Patients N % N % N % <5 yrs. 23 15% 54 21% 77 19% 5-12 yrs. 38 25% 50 19% 88 21% 13-19 yrs. 13 8% 22 8% 35 8% 20-29 yrs. 24 16% 20 8% 44 11% 30-39 yrs. 16 10% 30 11% 46 11% 40-49 yrs. 19 12% 23 9% 42 10% 50-59 yrs. 11 7% 42 16% 53 13% 60+ yrs. 9 6% 21 8% 30 7% Total 153* 262 415* *=An additional three cases served this year were patients whose age was unknown. Table IIa: TOTAL NUMBER AND PERCENT OF PERSONS SERVED BY AGE GROUP (new patients only) 2010-Present N % <5 yrs. 314 29% 5-12 yrs. 199 19% 13-19 yrs. 76 8% 20-29 yrs. 92 9% 30-39 yrs. 83 8% 40-49 yrs. 90 8% 50-59 yrs. 102 10% 60+ yrs. 91 9% Total 1089* *=An additional 36 persons were served by the project in prior years, whose ages were unknown. Discussion: Nearly half of the patients served by the project have been children below 13 yrs. old. The most recent figures show, however, that this proportion is dropping as the age distribution has become more diversified. In September, children accounted for 40% of those served. Well over 25% of those served are 40 years old or more. Table III: NUMBER AND PERCENT DISTRIBUTION OF DEVICES, January-September 2014 Returning Patients New Patients Total Patients Type of Device N % N % N % Above knee prosthesis 30 18% 31 11% 61 13% Below knee prosthesis 60 36% 46 16% 106 23% Ankle-foot orthosis 31 19% 77 26% 108 24% KAFO/knee brace 27 16% 24 8% 51 11% Pedorthic 12 7% 48 16% 60 13% Upper limb device 2 1% 40 14% 42 9% Other 4 2% 25 9% 29 6% Total 166 291 457 2 Table IIIa: TOTAL NUMBER AND PERCENT DISTRIBUTION OF DEVICES (new patients only) 2010-2014 Type of Device Above knee prosthesis Below knee prosthesis Ankle-foot orthosis Knee-ankle-foot orthosis Pedorthic Upper limb device Other Total N 155 135 480 124 172 64 69 1199 % 13% 11% 40% 10% 14% 5% 6% Discussion: Over 40% of those served have been provided Ankle-foot braces. This is almost three times more than any other type of device. Looking only at 2014 information, these devices account for less than ¼ of the total devices provided with the demand for below-knee prostheses being almost the same. Just below ¼ of all patients served were provided lower limb prostheses. However, in the current year, the proportion rises to some 36%. While during the course of the project more patients were fit for Above knee rather than Below knee prostheses, this year there are almost double the persons receiving below knee than above knee devices. 3
