Data analysis worksheet
advertisement

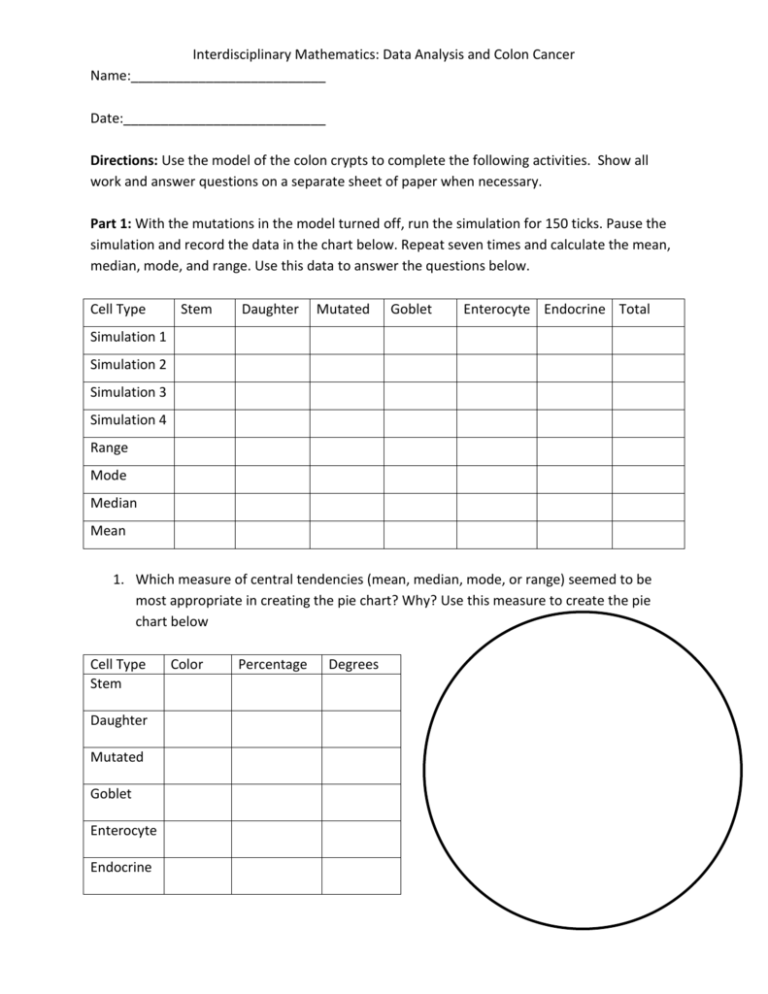
Interdisciplinary Mathematics: Data Analysis and Colon Cancer Name:__________________________ Date:___________________________ Directions: Use the model of the colon crypts to complete the following activities. Show all work and answer questions on a separate sheet of paper when necessary. Part 1: With the mutations in the model turned off, run the simulation for 150 ticks. Pause the simulation and record the data in the chart below. Repeat seven times and calculate the mean, median, mode, and range. Use this data to answer the questions below. Cell Type Stem Daughter Mutated Goblet Enterocyte Endocrine Total Simulation 1 Simulation 2 Simulation 3 Simulation 4 Range Mode Median Mean 1. Which measure of central tendencies (mean, median, mode, or range) seemed to be most appropriate in creating the pie chart? Why? Use this measure to create the pie chart below Cell Type Stem Daughter Mutated Goblet Enterocyte Endocrine Color Percentage Degrees Use the data from Part 1 to answer the following questions: 2. What is the probability that a random cell in the crypt is a stem cell? Daughter cell? Mutated cell? 3. Given that a cell has differentiated, what is the probability that the cell is a Goblet? Enterocyte? Endocrine? How do these experimental probabilities differ from the theoretical probabilities? Part 2: Run the simulation again with Mutated? = yes, Rat- of-duplication = 2, and StemCellsPerCrypt=2. Allow the simulation to run for 150 ticks. Record the cell counts: Cell Type Stem Daughter Mutated Simulation 1 Simulation 2 Mean Create a pie chart with the mean cell counts: Cell Type Stem Daughter Mutated Goblet Enterocyte Endocrine Color Percentage Degrees Goblet Enterocyte Endocrine Total Use the data and the pie chart from Part 2 to answer the following questions: 1. Now what is the probability that a random cell is a stem cell? Daughter cell? Mutated Cell? How does this answer compare to your answer in Part 1? 2. Why might the cell counts used in the second pie chart be less accurate than the counts used in the other pie chart? Part 3: Run the simulation again with Mutated? = yes, Rate-of-duplication = 3, and StemCellsPerCrypt = 2. Record the cell counts: Cell Type Stem Daughter Mutated Goblet Enterocyte Endocrine Total Simulation 1 Simulation 2 Mean Answer the following questions using the data from Part 2 and Part 3: 1. How did the new cell count means change from the cell count means in Part 2? 2. Using your answer from the previous question, make an educated conjecture as to what would happen if you made Rate-of-duplication = 4. 3. Run the simulation again with Rate-of-duplication = 4. What was correct about your conjecture? What would you revise about it? Use mathematical terminology where appropriate.


