Ch02 Learning Tips
advertisement
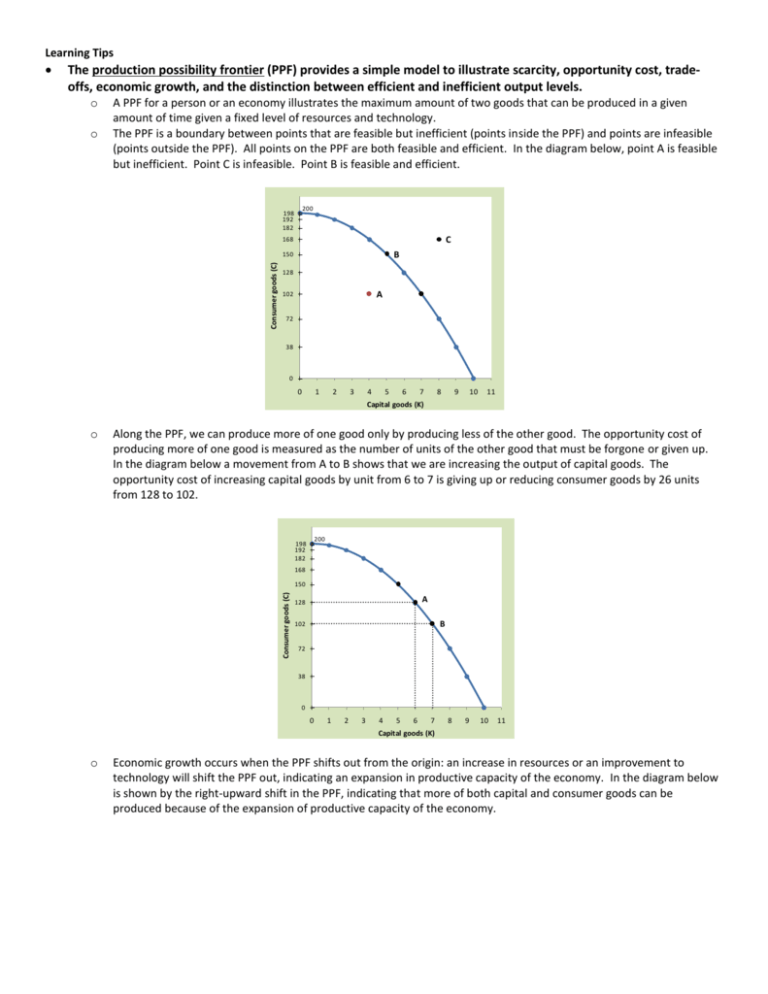
Learning Tips The production possibility frontier (PPF) provides a simple model to illustrate scarcity, opportunity cost, tradeoffs, economic growth, and the distinction between efficient and inefficient output levels. o o A PPF for a person or an economy illustrates the maximum amount of two goods that can be produced in a given amount of time given a fixed level of resources and technology. The PPF is a boundary between points that are feasible but inefficient (points inside the PPF) and points are infeasible (points outside the PPF). All points on the PPF are both feasible and efficient. In the diagram below, point A is feasible but inefficient. Point C is infeasible. Point B is feasible and efficient. 200 198 192 182 C 168 B Consumer goods (C) 150 128 A 102 72 38 0 0 1 2 3 4 5 6 7 8 9 10 11 Capital goods (K) o Along the PPF, we can produce more of one good only by producing less of the other good. The opportunity cost of producing more of one good is measured as the number of units of the other good that must be forgone or given up. In the diagram below a movement from A to B shows that we are increasing the output of capital goods. The opportunity cost of increasing capital goods by unit from 6 to 7 is giving up or reducing consumer goods by 26 units from 128 to 102. 200 198 192 182 168 150 Consumer goods (C) A 128 B 102 72 38 0 0 1 2 3 4 5 6 7 8 9 10 11 Capital goods (K) o Economic growth occurs when the PPF shifts out from the origin: an increase in resources or an improvement to technology will shift the PPF out, indicating an expansion in productive capacity of the economy. In the diagram below is shown by the right-upward shift in the PPF, indicating that more of both capital and consumer goods can be produced because of the expansion of productive capacity of the economy. 240 Consumer goods (C) 200 E 142 128 A 0 1 2 3 4 5 6 7 8 9 10 11 12 Capital goods (K) Exercises 1) Baharestan is a isolated country producing rice and goat cheese. The following table shows different combinations of rice and coconuts that Baharestan can produce in a year. Maximum annual output options A B C D E F a) Bushels of rice 2,000 1,600 1,200 800 400 0 Pounds of goat cheese 0 250 450 600 700 800 Graph combinations A-F on the following graph and then connect these combinations to create Baharestan’s PPF. Bushels 2,200 of rice 2,000 1,800 1,600 1,400 1,200 1,000 800 600 400 200 0 0 100 200 300 400 500 600 700 800 900 Pounds of goat cheese b) Consider the following production combinations for Baharestan. For each combination determine which of the following classifications best describes the combination: I. The combination is feasible and efficient. II. The combination is feasible but inefficient. III. The combination is not feasible. i) 300 pounds of goat cheese, 1,200 bushels of rice. _______ ii) 450 pounds of goat cheese, 1,400 bushels of rice. _______ iii) 500 pounds of goat cheese, 600 bushels of rice. _______ iv) 725 pounds of goat cheese, 600 bushels of rice. _______ v) 250 pounds of goat cheese, 1,600 bushels of rice. _______ c) What is the opportunity cost of producing: i) 600 pounds of goat cheese instead of zero pounds of goat cheese? _______ ii) 1,600 bushels of rice instead of 800 bushels of rice? _______ iii) 700 pounds of goat cheese instead of 250 pounds of goat cheese? _______ 2) Suppose an economy produces only two goods, cheese and wine. The production possibility of this economy is given in the following diagram. Wine per year A F B C G D E Cheese per year a) Which point on the diagram will this economy produce at if it devotes all of its resources to wine production? ______ b) Which point on the diagram represents a feasible but inefficient point for this economy? ______. Explain your answer. c) Which point on the diagram may become feasible if this economy experiences economic growth? ______. Explain your answer. d) Explain how you would measure the opportunity cost of moving from point C to point B. The model of comparative advantage illustrates why specialization and trade is advantageous to people and countries even if a person or a country does not have the absolute advantage in producing any good. It is possible for individuals, countries, or regions with a country, to be better off if they specialize according to their comparative advantage and then trade with one another. A country has a comparative advantage in producing a good if it can produce the good at lower opportunity cost than can another country. For example, if state of Nebraska’s opportunity cost of producing one more unit of bread is two units of cheese, while state Wisconsin’s opportunity cost of producing one more units of bread is three units of cheese, then Nebraska has a comparative advantage in producing bread and should produce bread. Conversely, Nebraska’s opportunity cost of producing one more unit of cheese is ½ unit of bread, while Wisconsin’s opportunity cost of producing one more unit of cheese is ⅓. Then Wisconsin has comparative advantage in cheese (⅓ < ½) and it should produce cheese. In the table below, if Nebraska produced no bread and all cheese, total cheese output would be 100. Given Wisconsin’s resources the total cheese output, with no bread, would be 90. No-cheese-all-bread output for Nebraska is 50 and for Wisconsin is 30. Nebraska has absolute advantage in both cheese and bread. Nebraska Wisconsin Cheese 100 90 Bread 50 30 The linear production possibility equations and graphs for the two states are shown below: Nebraska: Wisconsin: C = 100 – 2B C = 90 – 3B Cheese 100 90 Nebraska Wisconsin 30 50 Bread The Wisconsin PPF’s slope is −3, while that of Nebraska is −2. The costs more for Wisconsin to produce bread because it gives up 3 units of cheese for each additional unit of bread. It costs less for Nebraska to produce bread because it gives up 2 units of cheese for each extra unit of bread. Exercise 3) Andy and Sandy both produce bread and milk. The table below provides information about some of the combinations of bread and milk Andy and Sandy can produce from their given resources. Andy Bread 100 80 60 40 20 0 a) Sandy Milk 0 30 60 90 120 150 Bread 120 90 60 30 0 Milk 0 40 80 120 160 Draw Andy and Sandy’s production possibility frontier on the following graphs. Andy Sandy 180 180 Gallons of milk 160 Gallons of milk 160 140 140 120 120 100 100 80 80 60 60 40 40 20 20 0 0 0 20 40 60 80 100 120 0 20 Pounds of bread b) c) d) e) f) g) Which person has the absolute advantage in the production of butter? _______ Which person has the absolute advantage in the production milk? _______ What is the opportunity cost of producing one pound of bread for Andy? _______ What is the opportunity cost of producing one pound of bread for Sandy? _______ What is the opportunity cost of producing one gallon of milk for Andy? _______ What is the opportunity cost of producing one gallon of milk for Sandy? _______ 40 60 80 100 120 Pounds of bread h) Who has the comparative advantage in the production of bread? _______ i) Who has the comparative advantage in the production of milk? _______ The circular flow diagram of the market economy illustrates the relationship between households and firms as they interact in both the product and factor markets. Households provide factors of production, while firms produce goods and services using those factors. Households use the income they earn from selling their factors of production to purchase the goods and services produced by the firms. In the circular-flow diagram income equals expenditures. The circular-flow diagram depicts two flow: the flows of factors of production and goods and service (physical flow) in one direction, and the flow of income and expenditure (monetary flow) in the opposite direction. Households $ Demand for goods and services Household expenditures $ Supply of factors Market for goods and services Factor markets Supply of goods and services Firm revenues Factor income $ Demand for factors Firms Payments to factors $ ANSWERS TO EXERCISES 1) Baharestan is a isolated country producing rise and goat cheese. The following table shows different combinations of rice and coconuts that Pacifica can produce in a year. Maximum annual output options A B C D E F a) Bushels of rice 2,000 1,600 1,200 800 400 0 Pounds of goat cheese 0 250 450 600 700 800 Graph combinations A-F on the following graph and then connect these combinations to create Baharestan’s PPF. Bushels 2,200 of rice 2,000 1,800 1,600 1,400 1,200 1,000 800 600 400 200 0 0 100 200 300 400 500 600 700 800 900 Pounds of goat cheese b) Consider the following production combinations for Baharestan. For each combination determine which of the following classifications best describes the combination: I. The combination is feasible and efficient. II. The combination is feasible but inefficient. III. The combination is not feasible. i) 300 pounds of goat cheese, 1,200 bushels of rice. II ii) 450 pounds of goat cheese, 1,400 bushels of rice. III iii) 500 pounds of goat cheese, 600 bushels of rice. II iv) 725 pounds of goat cheese, 600 bushels of rice. III v) 250 pounds of goat cheese, 1,600 bushels of rice. I c) What is the opportunity cost of producing: i) 600 pounds of goat cheese instead of zero pounds of goat cheese? 1,200 bushels of rice forgone. ii) 1,600 bushels of rice instead of 800 bushels of rice? 350 pounds of goat cheese forgone. iii) 700 pounds of goat cheese instead of 250 pounds of goat cheese? 1,200 bushels of rice. 2) Suppose an economy produces only two goods, cheese and wine. The production possibility of this economy is given in the following diagram. Wine per year A F B C G D E Cheese per year a) Which point on the diagram will this economy produce at if it devotes all of its resources to wine production? A b) Which point on the diagram represents a feasible but inefficient point for this economy? G. Explain your answer. Point B is feasible since it is a combination that is inside the PPF, but is inefficient because it would be possible to increase the production of both wine and cheese. c) Which point on the diagram may become feasible if this economy experiences economic growth? F. Explain your answer. Point F currently is not a feasible point since it lies outside the PPF. However, if there is economic growth the PPF will shift out, resulting in the ability to produce more of both goods. d) Explain how you would measure the opportunity cost of moving from point C to point B. The opportunity cost of moving from point C to B is measured by the units of cheese per year that must be given up in order to increase wine production. 3) Andy and Sandy both produce bread and milk. The table below provides information about some of the combinations of bread and milk Andy and Sandy can produce from their given resources. Andy Bread 100 80 60 40 20 0 a) Sandy Milk 0 30 60 90 120 150 Bread 120 90 60 30 0 Milk 0 40 80 120 160 Draw Andy and Sandy’s production possibility frontier on the following graphs. Andy Sandy 180 180 Gallons of milk 160 Gallons of milk 160 140 140 120 120 100 100 80 80 60 60 40 40 20 20 0 0 0 20 40 60 80 100 120 Pounds of bread 0 20 40 60 80 100 120 Pounds of bread b) Which person has the absolute advantage in the production of bread? Sandy. Sandy has absolute advantage in production bread over Andy because she can produce 120 pounds against Andy’s 100 pounds. c) Which person has the absolute advantage in the production milk? Sandy. Sandy has absolute advantage in production of milk over Andy because she can produce 160 gallons of milk against Andy’s 150 gallons. d) What is the opportunity cost of producing one pound of bread for Andy? 1.5. Andy gives up 1.5 gallons of milk for each extra pound of bread. The opportunity cost is shown as the slope of the PPF: 150 ∕ 100 = 1.5. e) What is the opportunity cost of producing one pound of bread for Sandy? 1.33. Sandy gives up 1.33 gallons of milk for each extra pound of bread. The opportunity cost is shown as the slope of the PPF: 160 ∕ 120 = 1.33. f) What is the opportunity cost of producing one gallon of milk for Andy? The opportunity cost of milk for Andy in terms of bread given up is the inverse of the opportunity cost of bread: 1 ∕ 1.5 = 0.67. g) What is the opportunity cost of producing one gallon of milk for Sandy? The opportunity cost of milk for Sandy in terms of bread given up is the inverse of the opportunity cost of bread: 1 ∕ 1.33 = 0.75. h) Who has the comparative advantage in the production of bread? The opportunity cost of producing bread, in terms of gallons of milk given up, is lower for Sandy (1.33 gallons versus Andy’s 1.5 gallons). She has the comparative advantage in the production of bread. i) Who has the comparative advantage in the production of milk? The opportunity cost of producing milk, in terms of pounds of bread give up, is lower for Andy (0.67 pounds versus Sandy’s 0.75). Andy as the comparative advantage in the production of milk.
