(PV92 Alu insert) Lab
advertisement
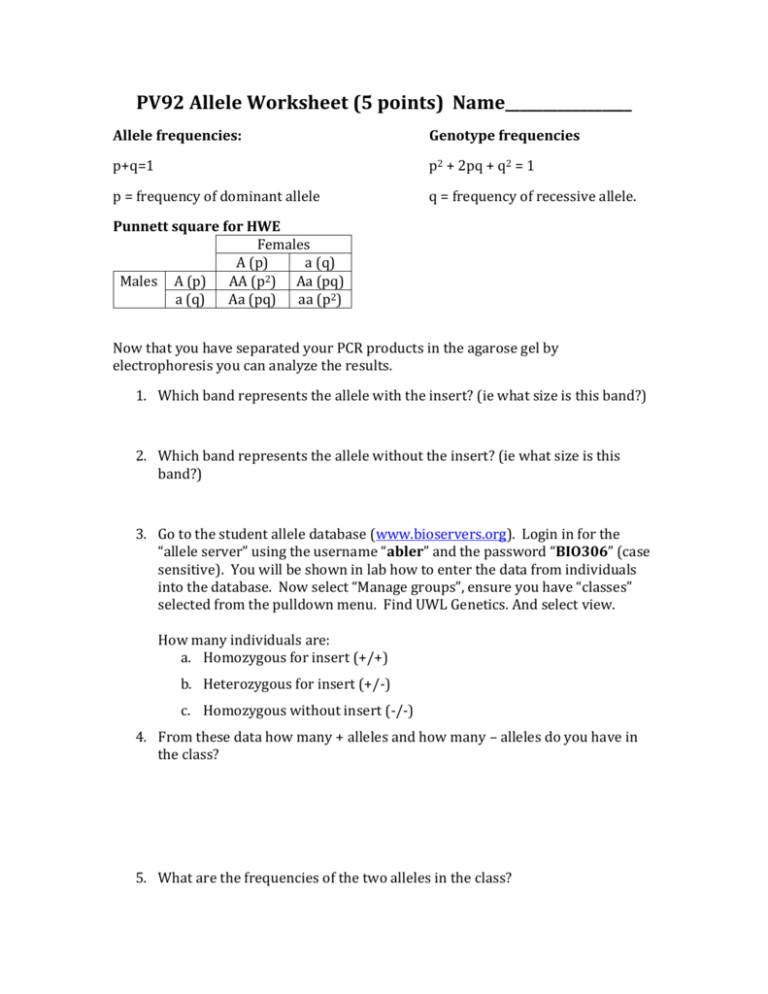
PV92 Allele Worksheet (5 points) Name_________________ Allele frequencies: Genotype frequencies p+q=1 p2 + 2pq + q2 = 1 p = frequency of dominant allele q = frequency of recessive allele. Punnett square for HWE Females A (p) a (q) 2 Males A (p) AA (p ) Aa (pq) a (q) Aa (pq) aa (p2) Now that you have separated your PCR products in the agarose gel by electrophoresis you can analyze the results. 1. Which band represents the allele with the insert? (ie what size is this band?) 2. Which band represents the allele without the insert? (ie what size is this band?) 3. Go to the student allele database (www.bioservers.org). Login in for the “allele server” using the username “abler” and the password “BIO306” (case sensitive). You will be shown in lab how to enter the data from individuals into the database. Now select “Manage groups”, ensure you have “classes” selected from the pulldown menu. Find UWL Genetics. And select view. How many individuals are: a. Homozygous for insert (+/+) b. Heterozygous for insert (+/-) c. Homozygous without insert (-/-) 4. From these data how many + alleles and how many – alleles do you have in the class? 5. What are the frequencies of the two alleles in the class? Remember the Hardy-Weinberg Equation predicts a specific proportion of genotypes based on the allele frequencies. From your known allele frequencies predict the genotypes expected at Hardy-Weinberg Equilibrium Expected Frequency Expected Number +/+ +/-/Now you have observed genotypes and expected genotypes (if the population was at equilibrium/not evolving). 6. State the hypothesis you intend to test. 7. Calculate a Χ2 value for your data. 8. How many degrees of freedom do you have? What is the critical p-value, and corresponding X2 value? 9. What is the p range for your X2 value 10. What do you conclude? Now that we’ve thought about X2 testing we don’t need to go through all the math ourselves, so from now on we’ll let the computer do that for us. It will provide us with a p-value that we can then interpret. Go back to the webpage and once again select “manage groups” and find UWL Genetics. Select the box next to the name and click “OK”. Go back to “Manage groups”, this time select “Reference” from the pulldown menu. This will give you a list of all the reference populations that have been sampled. Select at least one population from each continent and then click “OK”. 11. For each reference population, record the allele frequency of each allele. 1. Name ______________ + =_____ -=________ 4. Name ______________ + =_____ -=________ 2. Name ______________ + =_____ -=________ 5. Name ______________ + =_____ -=________ 3. Name ______________ + =_____ -=________ 6. Name ______________ + =_____ -=________ 12. On the right side of the screen you will see a column of bubbles. Select a population by clicking in the appropriate bubble. At the top of the column is a button titled “Analyze”. Click this button and the computer will perform a X2 analysis comparing the population genotypes to the Hardy-Weinberg Equilibrium expected from that population’s allele frequencies (i.e., repeating steps 5-10 for you). Note the p-values and list which populations: May be in Equilibrium/not evolving (we fail to reject) Are not in equilibrium/are evolving (we reject) 13. What does this suggest about most populations? __________________________________ 14. Now we can compare populations. We can use a X2 test to analyze whether two populations have the same frequency of genotypes. Select the UWL_Genetics group and one reference population by clicking on the boxes to the left of the names. Select “COMPARE” to run the X2 analysis. Which population(s) appear most likely to have the same genotypic frequencies as the UWL genetics class? 15. You can use the data on the server to predict in which reference population the original PV92 allele arose. Since the allele has been in that population the longest, it has had a long time to spread through that population by “random” mating. Therefore, would you expect the allele to be close to or far from Hardy Weinberg equilibrium for this population? 16. What if scientists discovered that people who have the insert are resistant to a disease found predominantly in the part of the world you identified as the place the insert originated? Would this affect your hypothesis? If so, tell me how this would affect insert allele frequency.


