here - Science with Ms. Wang
advertisement
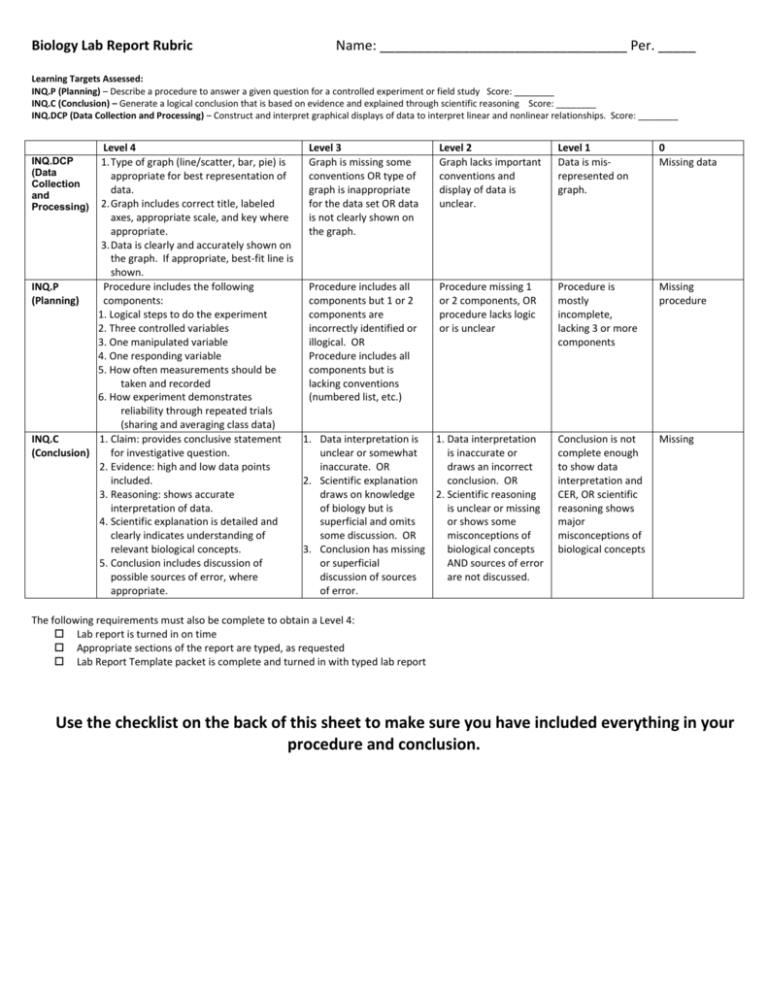
Biology Lab Report Rubric Name: _________________________________ Per. _____ Learning Targets Assessed: INQ.P (Planning) – Describe a procedure to answer a given question for a controlled experiment or field study Score: ________ INQ.C (Conclusion) – Generate a logical conclusion that is based on evidence and explained through scientific reasoning Score: ________ INQ.DCP (Data Collection and Processing) – Construct and interpret graphical displays of data to interpret linear and nonlinear relationships. Score: ________ Level 4 Level 3 Level 2 1. Type of graph (line/scatter, bar, pie) is Graph is missing some Graph lacks important appropriate for best representation of conventions OR type of conventions and data. graph is inappropriate display of data is 2. Graph includes correct title, labeled for the data set OR data unclear. axes, appropriate scale, and key where is not clearly shown on appropriate. the graph. 3. Data is clearly and accurately shown on the graph. If appropriate, best-fit line is shown. INQ.P Procedure includes the following Procedure includes all Procedure missing 1 (Planning) components: components but 1 or 2 or 2 components, OR 1. Logical steps to do the experiment components are procedure lacks logic 2. Three controlled variables incorrectly identified or or is unclear 3. One manipulated variable illogical. OR 4. One responding variable Procedure includes all 5. How often measurements should be components but is taken and recorded lacking conventions 6. How experiment demonstrates (numbered list, etc.) reliability through repeated trials (sharing and averaging class data) INQ.C 1. Claim: provides conclusive statement 1. Data interpretation is 1. Data interpretation (Conclusion) for investigative question. unclear or somewhat is inaccurate or 2. Evidence: high and low data points inaccurate. OR draws an incorrect included. 2. Scientific explanation conclusion. OR 3. Reasoning: shows accurate draws on knowledge 2. Scientific reasoning interpretation of data. of biology but is is unclear or missing 4. Scientific explanation is detailed and superficial and omits or shows some clearly indicates understanding of some discussion. OR misconceptions of relevant biological concepts. 3. Conclusion has missing biological concepts 5. Conclusion includes discussion of or superficial AND sources of error possible sources of error, where discussion of sources are not discussed. appropriate. of error. INQ.DCP (Data Collection and Processing) Level 1 Data is misrepresented on graph. 0 Missing data Procedure is mostly incomplete, lacking 3 or more components Missing procedure Conclusion is not complete enough to show data interpretation and CER, OR scientific reasoning shows major misconceptions of biological concepts Missing The following requirements must also be complete to obtain a Level 4: Lab report is turned in on time Appropriate sections of the report are typed, as requested Lab Report Template packet is complete and turned in with typed lab report Use the checklist on the back of this sheet to make sure you have included everything in your procedure and conclusion. INQ.P (Planning): PROCEDURE Controlled Variables - At least three controlled variables are identified or implied in the procedure. Manipulated Variable - Only one manipulated variable is identified in the procedure. Responding Variable - The responding variable is clearly identified in the procedure Record Measurements - The procedure states when / to take measurements and explicitly states to record all measurements (phrase take measurements cannot be used to mean record). Trials are Repeated - More than one trial for all conditions is planned to measure responding variable or step is included that suggests group data will be shared and averaged Logical Steps - The steps of the procedure are detailed enough to repeat the procedure effectively INQ.C (Conclusion) Claim: □ Provides conclusive statement (claim) for investigative questions Evidence: □ Provides evidence for “high” data point (group and class data) □ Provides evidence for “low” data point (group and class data) Reasoning: □ Provides reasoning that links evidence to claim □ Provides scientific explanation of diffusion □ Provides scientific reasoning for why gummy bears increased in mass o Explains how gummy bear is semi-permeable o (HONORS ONLY) Explains concept of concentration gradient (differences in concentration) o Explains role of diffusion in this experiment o Uses facts about matter to explain increase in mass □ (REGULAR ONLY) Provides scientific explanation for why gummy bears in 100% water increases in mass more than gummy bears in 100% corn syrup □ (HONORS ONLY) Provides scientific explanation for why gummy bears in higher concentrations of water increases in mass more than those in lower concentrations of water
