MODELING UTAH POPULATION DATA - Nerrissa`s E
advertisement
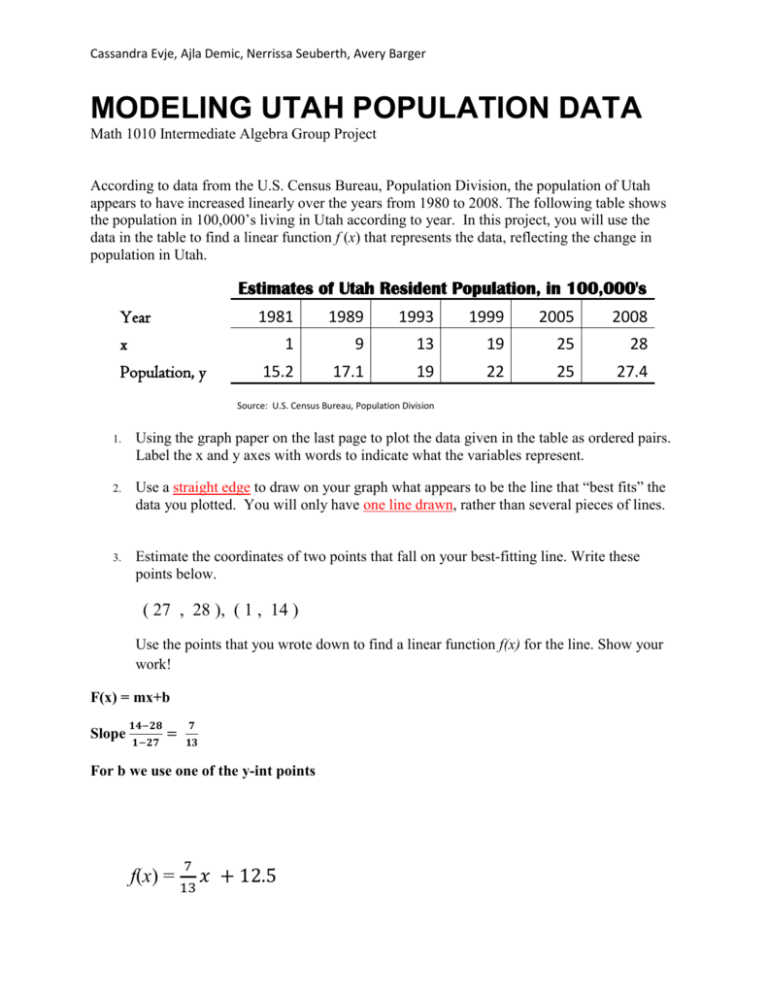
Cassandra Evje, Ajla Demic, Nerrissa Seuberth, Avery Barger MODELING UTAH POPULATION DATA Math 1010 Intermediate Algebra Group Project According to data from the U.S. Census Bureau, Population Division, the population of Utah appears to have increased linearly over the years from 1980 to 2008. The following table shows the population in 100,000’s living in Utah according to year. In this project, you will use the data in the table to find a linear function f (x) that represents the data, reflecting the change in population in Utah. Estimates of Utah Resident Population, in 100,000's Year 1981 1989 1993 1999 2005 2008 1 9 13 19 25 28 15.2 17.1 19 22 25 27.4 x Population, y Source: U.S. Census Bureau, Population Division 1. 2. 3. Using the graph paper on the last page to plot the data given in the table as ordered pairs. Label the x and y axes with words to indicate what the variables represent. Use a straight edge to draw on your graph what appears to be the line that “best fits” the data you plotted. You will only have one line drawn, rather than several pieces of lines. Estimate the coordinates of two points that fall on your best-fitting line. Write these points below. ( 27 , 28 ), ( 1 , 14 ) Use the points that you wrote down to find a linear function f(x) for the line. Show your work! F(x) = mx+b Slope 𝟏𝟒−𝟐𝟖 𝟏−𝟐𝟕 = 𝟕 𝟏𝟑 For b we use one of the y-int points f(x) = 7 13 𝑥 + 12.5 Cassandra Evje, Ajla Demic, Nerrissa Seuberth, Avery Barger 4. What is the slope of your line? m= 7 = .54 13 It might make sense to write your slope as a decimal. Interpret its meaning using a phrase like “for any one unit increase in x we expect an m unit increase in y. Does it make sense in the context of this situation? Please use complete sentences to respond to these questions. For any one unit increase in x, there is a unit increase of .54 in y. 5. Find the value of f (45) using your function from part 3. Show your work, then write your result in the blank below. 𝒇(𝟒𝟓) = 𝟕 (𝟒𝟓) + 𝟏𝟐. 𝟓 𝟏𝟑 = 24.3 + 12.5 = 36.8 f(45) = 36.8 Write a sentence interpreting the meaning of f (45) in the context of this project. What year does the 45 represent? In the equation f (45) =36.8, it is telling us that 45 years after 1980, the population is estimated to be 3.68 million. The 45 represents the year 2025. 6. Use your function from part 3 to approximate in what year the residential population of Utah reached 2,000,000. Show your work. 2,000,000=20(100,000) 20 = .54x + 12.5 -12.5 -12.5 𝟕.𝟓 = .𝟓𝟒𝒙 .𝟓𝟒 .𝟓𝟒 x = 13.9 𝒇(𝟏𝟒) = . 𝟓𝟒(𝟏𝟒) + 𝟏𝟐. 𝟓 = 𝟐𝟎. 𝟎𝟒 14 + 1980 = 1994 Cassandra Evje, Ajla Demic, Nerrissa Seuberth, Avery Barger 7. Compare your linear function with that of another student or group. Comparison function: f(x) = 𝟓 𝟏𝟏 𝐱+ 𝟏𝟓𝟓 𝟏𝟏 Is the comparison function the same as the function you wrote down for part 3? No If they are different, explain why. The two functions are different because both groups chose to use different data points. Therefore the function will have a different slope. The line is an estimation. In actuality, using a linear growth model for population is not common. Most models are exponential models, due to the fact that most populations experience relative growth, i.e. 2% growth per year (What does this mean? You might have to look this up). Linear models for nonlinear relationships like population work only within a small time frame valid close to the time of the data modeled. 8. Discuss some of the false conclusions you might reach if you use your linear model for times far from 1980-2008. When estimating population growth there are many variables that we cannot predict. The linear function gives a false conclusion of a consistent level of growth. Each year’s population growth will be greater than the previous year’s increase, thus resulting in more of an exponential growth. For data points far beyond the time frame of 1980-2008 inaccuracies will occur. For example if we go back to 1950 with the linear model the population will be a negative number. Cassandra Evje, Ajla Demic, Nerrissa Seuberth, Avery Barger 9. Determining a line of best fit using our method is sufficient for our project but leads to subjectivity from one student to the next. Thus a more appropriate method is to perform a linear regression in which every point is taken in to account to find the best line that fits the given data. This process is algebraically intensive but is performed with ease using technology. There are many free programs online that will do a linear regression for you or you can create one in MS Excel. On our CANVAS page you will see a link to step by step instructions to create a linear regression and produce a nice graphic that can be copy and pasted into any word document. Here is a link that I found on YouTube that may also be helpful 10. Reflective Writing: This project is meant to connect our topic with lines to a bigger picture where linear equations are used in the real world. Please a small paragraph to discuss the following topics. a. Did this project change the way you think about application of mathematics? If so why? If not then how did it support your current beliefs? b. Discuss some other possible applications of Linear Regression c. There will be another part of this assignment that I will post on CANVAS Cassandra Evje, Ajla Demic, Nerrissa Seuberth, Avery Barger a) Yes, this project was a good way to finally see math put to use in a real world application. Most people believe that math is useless and isn’t applicable in everyday life, but this assignment takes the equations we have been learning in class and gives meaning/understanding to them. b) We can use linear Regression to estimate future sales of a company. If you know previous and current sales you can use that data to predict company growth or decline.
