MAth 1010 Project 1 Population Data
advertisement
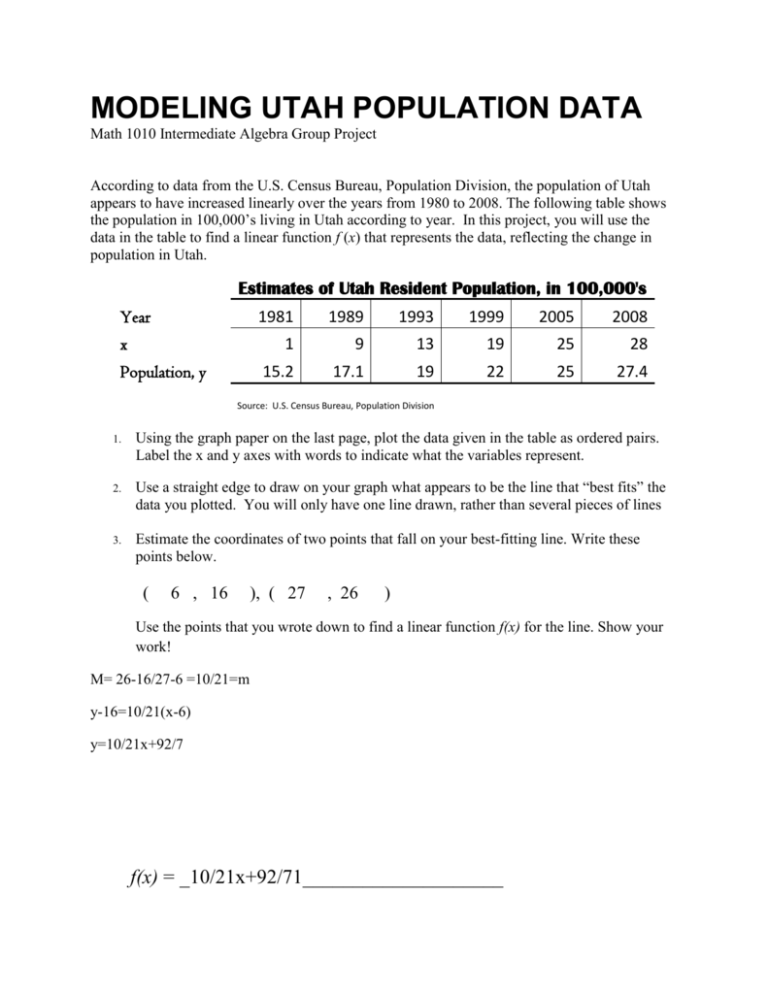
MODELING UTAH POPULATION DATA Math 1010 Intermediate Algebra Group Project According to data from the U.S. Census Bureau, Population Division, the population of Utah appears to have increased linearly over the years from 1980 to 2008. The following table shows the population in 100,000’s living in Utah according to year. In this project, you will use the data in the table to find a linear function f (x) that represents the data, reflecting the change in population in Utah. Estimates of Utah Resident Population, in 100,000's Year x Population, y 1981 1989 1993 1999 2005 2008 1 9 13 19 25 28 15.2 17.1 19 22 25 27.4 Source: U.S. Census Bureau, Population Division 1. 2. 3. Using the graph paper on the last page, plot the data given in the table as ordered pairs. Label the x and y axes with words to indicate what the variables represent. Use a straight edge to draw on your graph what appears to be the line that “best fits” the data you plotted. You will only have one line drawn, rather than several pieces of lines Estimate the coordinates of two points that fall on your best-fitting line. Write these points below. ( 6 , 16 ), ( 27 , 26 ) Use the points that you wrote down to find a linear function f(x) for the line. Show your work! M= 26-16/27-6 =10/21=m y-16=10/21(x-6) y=10/21x+92/7 f(x) = _10/21x+92/71____________________ 4. What is the slope of your line? m = _10/21_______ Interpret its meaning. Does it make sense in the context of this situation? Please use complete sentences to respond to these questions. The population is going up because the slope is positive. The population is going up 47,600 every year. 10/21 x 100,000 = 47619.05 5. Find the value of f (45) using your function from part 3. Show your work, then write your result in the blank below. F(45) = mx + b F(x) = 10/21(45) + 93/7 F(x) = 1667/7 f(45) = 166/7 or 238.14_________ Write a sentence interpreting the meaning of f (45) in the context of this project. In 45 years from 1980 the population goes up. 6. Use your function from part 3 to approximate in what year the residential population of Utah reached 2,000,000. Show your work. F(x) = 10/21x + 927/7 20 = 10/21x + 92/7 48/7 = 10/21x 72/5 = x 14.4 = x 1980 + 14.4 = 1994 7. Compare your linear function with that of another student or group. Comparison function: f(x) = _1/2 + 91/2____________________ Is the comparison function the same as the function you wrote down for part 3? No. If they are different, explain why. We used two different points to find the slope. The slope was found by a ghost line, not a line based on exact data. If they are the same, explain why. Not the same. 8. In actuality, using a linear growth model for population is not common. Most models are exponential models, due to the fact that most populations experience relative growth, i.e. 2% growth per year. Linear models for nonlinear relationships like population work only within a small time frame valid close to the time of the data modeled. Discuss some of the false conclusions you might reach if you use your linear model for times far from 1980-2008. Because we are using a liner equation and not an exact number our population will look much smaller and be less accurate over time.
