etc2755-sm-0001-SuppData-S1
advertisement

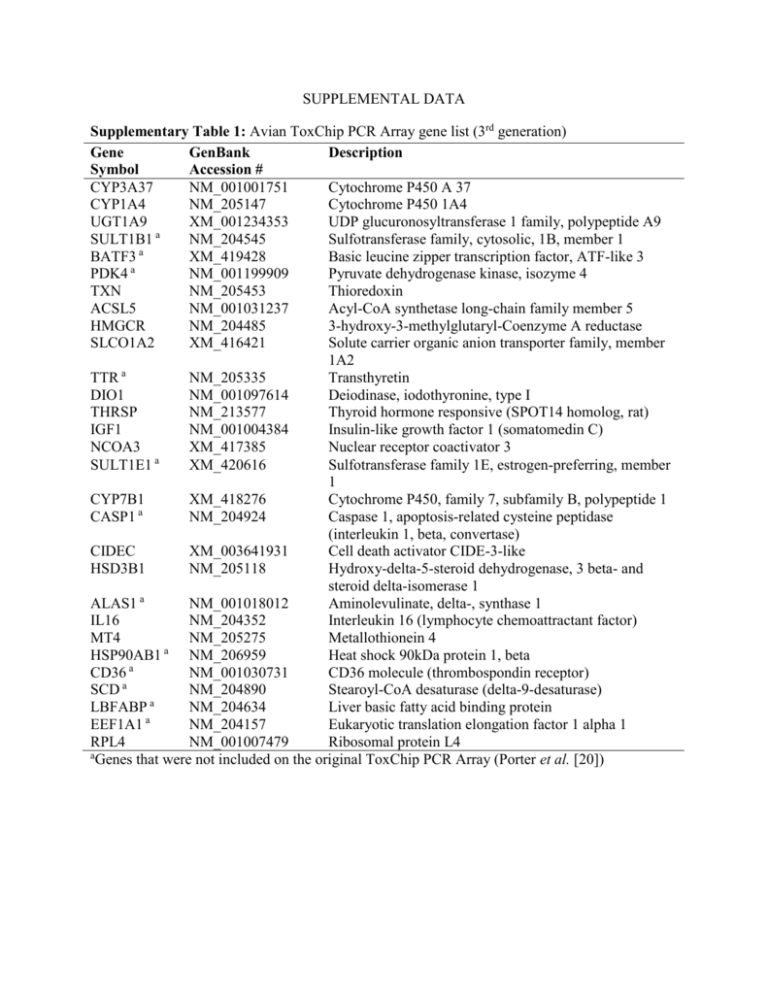
SUPPLEMENTAL DATA Supplementary Table 1: Avian ToxChip PCR Array gene list (3rd generation) Gene GenBank Description Symbol Accession # CYP3A37 NM_001001751 Cytochrome P450 A 37 CYP1A4 NM_205147 Cytochrome P450 1A4 UGT1A9 XM_001234353 UDP glucuronosyltransferase 1 family, polypeptide A9 SULT1B1 a NM_204545 Sulfotransferase family, cytosolic, 1B, member 1 a BATF3 XM_419428 Basic leucine zipper transcription factor, ATF-like 3 PDK4 a NM_001199909 Pyruvate dehydrogenase kinase, isozyme 4 TXN NM_205453 Thioredoxin ACSL5 NM_001031237 Acyl-CoA synthetase long-chain family member 5 HMGCR NM_204485 3-hydroxy-3-methylglutaryl-Coenzyme A reductase SLCO1A2 XM_416421 Solute carrier organic anion transporter family, member 1A2 a TTR NM_205335 Transthyretin DIO1 NM_001097614 Deiodinase, iodothyronine, type I THRSP NM_213577 Thyroid hormone responsive (SPOT14 homolog, rat) IGF1 NM_001004384 Insulin-like growth factor 1 (somatomedin C) NCOA3 XM_417385 Nuclear receptor coactivator 3 SULT1E1 a XM_420616 Sulfotransferase family 1E, estrogen-preferring, member 1 CYP7B1 XM_418276 Cytochrome P450, family 7, subfamily B, polypeptide 1 CASP1 a NM_204924 Caspase 1, apoptosis-related cysteine peptidase (interleukin 1, beta, convertase) CIDEC XM_003641931 Cell death activator CIDE-3-like HSD3B1 NM_205118 Hydroxy-delta-5-steroid dehydrogenase, 3 beta- and steroid delta-isomerase 1 a ALAS1 NM_001018012 Aminolevulinate, delta-, synthase 1 IL16 NM_204352 Interleukin 16 (lymphocyte chemoattractant factor) MT4 NM_205275 Metallothionein 4 HSP90AB1 a NM_206959 Heat shock 90kDa protein 1, beta a CD36 NM_001030731 CD36 molecule (thrombospondin receptor) SCD a NM_204890 Stearoyl-CoA desaturase (delta-9-desaturase) LBFABP a NM_204634 Liver basic fatty acid binding protein a EEF1A1 NM_204157 Eukaryotic translation elongation factor 1 alpha 1 RPL4 NM_001007479 Ribosomal protein L4 a Genes that were not included on the original ToxChip PCR Array (Porter et al. [20]) Supplementary Table 2: Raw cycle threshold (Ct) data derived from the Avian ToxChip PCR array for 27 target genes and two control genes in hepatic tissue of 6 individuals exposed via egg injection to the DMSO vehicle control (A) or 50 µg (116 nmol) TDCPP/g egg (B). Average Ct values (± standard deviation) are included and blank boxes represent wells in which no amplification was observed. A. Symbol Rep 1 Rep 2 CYP3A7 27.48 23.13 CYP1A4 24.28 24.83 UGT1A9 33.02 31.1 SULT1B1 24.26 22.49 BATF3 24.49 24.05 PDK4 22.47 21.28 TXN 20 18.65 ACSL5 25.08 23.7 HMGCR 26.36 24.69 SLCO1A2 28.7 29.12 TTR 15.75 14.91 DIO1 23.18 21.97 THRSP 34.24 IGF1 34.39 33.9 NCOA3 26.74 25.99 SULT1E1 22.4 21.22 CYP7B1 25.84 24.86 CASP1 26.2 25.02 LOC100859733 24.18 22.96 HSD3B1 27.36 27.01 ALAS1 24.52 22.58 IL16 31.5 30.42 MT4 22.38 27.8 HSP90AB1 26.07 24.5 CD36 22.85 22.02 SCD 30.93 30.29 LBFABP 20.01 19.06 EEF1A1 18.78 17.59 RPL4 19.42 18.12 DMSO Rep 3 Rep 4 Rep 5 Rep 6 AVG SD 26.51 22.35 23.82 23.76 24.51 2.02 24.67 21.97 22.13 21.28 23.19 1.57 30.58 28.07 29.33 29.96 30.34 1.68 22.28 21.31 21.93 21.27 22.26 1.10 24.79 23.59 23.35 22.35 23.77 0.88 21.38 20.32 21.1 20.82 21.23 0.72 17.75 16.99 19.06 17.65 18.35 1.10 24.23 21.76 22.46 21.85 23.18 1.36 25.69 22.73 23.79 23.28 24.42 1.41 30.04 26.9 29.07 28.51 28.72 1.04 14.55 14.61 15.21 14.82 14.98 0.45 21.9 21.02 21.58 21.19 21.81 0.77 33.2 33.33 35 33.52 33.86 0.75 33.81 29.99 34.96 32.44 33.25 1.80 25.8 23.4 24.49 23.71 25.02 1.35 20.68 19.73 20.52 19.82 20.73 0.99 25.97 22.36 23.55 23.22 24.30 1.48 24.9 23.86 25.3 24.27 24.93 0.82 22.99 21.83 22.94 22.94 22.97 0.74 26.39 25.43 26.35 25.89 26.41 0.71 21.24 21.22 23.38 22.73 22.61 1.27 30.24 28.07 30.04 29.59 29.98 1.13 26.62 24.37 22.05 21.11 24.06 2.69 25.5 21.91 23.6 22.77 24.06 1.60 22.13 20.5 20.84 20.48 21.47 1.00 29.97 27.62 28.45 27.59 29.14 1.44 19.7 19.4 18.52 18.59 19.21 0.60 18.32 15.89 16.79 16.28 17.28 1.15 17.81 16.79 18.19 17.58 17.99 0.87 B. Symbol Rep 1 Rep 2 CYP3A7 22.19 20.99 CYP1A4 27.69 23.57 UGT1A9 29.69 27.13 SULT1B1 22.48 21.55 BATF3 24.54 22.76 PDK4 23.04 20.84 TXN 19.76 17.68 ACSL5 24.21 22.75 HMGCR 25.13 23.81 SLCO1A2 27.12 23.66 TTR 15.78 13.62 DIO1 22.7 20.88 THRSP 34.11 IGF1 32.97 NCOA3 25.71 24.15 SULT1E1 21.91 19.55 CYP7B1 24.94 23.89 CASP1 25.23 23.59 LOC100859733 23.17 22.14 HSD3B1 27.18 24.76 ALAS1 23.05 19.85 IL16 31.63 27.85 MT4 29.36 26.48 HSP90AB1 24.58 22.86 CD36 22 20.87 SCD 29.16 28.17 LBFABP 19.11 16.3 EEF1A1 16.93 16.44 RPL4 18.92 16.74 TDCPP 50 ug/g Rep 3 Rep 4 21.13 20.45 24.73 24.49 27.68 28.77 21.95 21.2 22.94 23.45 21.05 20.39 18.5 18.05 22.39 21.92 23.54 23.37 24.69 24.93 14.56 14.33 21.4 20.9 33.33 33.27 33.57 33.89 24.32 24.25 20.58 20.03 24.02 23.84 24.33 24.18 22.7 22.59 25.61 24.45 21.44 21.19 29.06 28.35 28.45 26.2 22.9 23.03 21.22 20.44 28.83 27.86 17.85 16.41 16.35 15.86 17.79 17.33 Rep 5 Rep 6 AVG SD 21.49 21.11 21.23 0.58 25.56 25.48 25.25 1.40 27.77 27.2 28.04 1.00 22.18 22.1 21.91 0.46 23.93 24.23 23.64 0.71 21.13 22.52 21.50 1.04 18.67 18.62 18.55 0.71 23.81 23.17 23.04 0.86 24.59 24.48 24.15 0.69 25.9 24.57 25.15 1.20 15.43 15.7 14.90 0.87 22.48 22.39 21.79 0.83 36.85 34.93 34.13 0.83 33.28 33.43 0.39 25.27 24.83 24.76 0.63 21.27 22 20.89 1.00 25.12 24.72 24.42 0.57 25.56 25.67 24.76 0.85 23.72 23.59 22.99 0.62 25.56 25.56 25.52 0.95 22.49 23.1 21.85 1.27 29.44 29.37 29.28 1.30 29.53 25.28 27.55 1.80 24.62 24.11 23.68 0.85 21.81 21.65 21.33 0.60 28.77 29.24 28.67 0.55 18.59 18.7 17.83 1.21 17.27 16.61 16.58 0.49 19.21 18.63 18.10 0.97 Supplementary Table 3: Effects of 10 µM bis(1,3-dichloro-2-propyl) phosphate, 24 h exposure on mRNA expression levels in chicken embryo hepatocytes. Shaded cells indicate a significant difference in mRNA levels relative to the DMSO control (Two-tailed t-test; p ≤0.05; Fold change ≥1.7; n=3). Gene Symbol CYP3A37 CYP1A4 UGT1A9 SULT1B1 BATF3 PDK4 TXN ACSL5 HMGCR SLCO1A2 TTR DIO1 THRSP IGF1 NCOA3 SULT1E1 CYP7B1 CASP1 CIDEC HSD3B1 ALAS1 IL16 MT4 HSP90AB1 CD36 SCD LBFABP P-value Fold Change 0.16 0.02 0.07 0.87 0.11 0.78 0.68 0.23 0.51 0.36 0.08 0.32 0.30 0.31 0.21 0.08 0.11 0.90 0.18 0.06 0.05 0.13 0.01 0.97 0.79 0.19 0.37 1.13 2.34 -1.55 -1.01 -1.17 1.08 1.03 1.14 -1.10 -1.15 1.18 1.10 -1.21 -1.19 -1.17 1.17 -1.47 1.01 1.16 -1.43 1.18 -1.29 -1.62 -1.00 1.04 -1.14 1.12 Supplementary Figure 1: Relationship between fold changes of gene targets on the Avian ToxChip PCR array measured on embryonic day 18 for the in ovo exposure (50 µg/g TDCPP) and at 3 (A), 18 (B), 24 (C), and 36 hours (D) for the in vitro (10 µM TDCPP) exposure. The line of best fit and associated R value are included for each time point. B. 5 -15 -10 10 R = 0.64 -5 5 10 15 -5 In vitro - 10 M TDCPP In vitro - 10 M TDCPP A. 5 -15 -10 -5 5 10 15 -5 -10 -10 In ovo - 50 g/g TDCPP In ovo - 50 g/g TDCPP C. D. 30 R = 0.503 10 5 -15 -10 -5 5 10 -5 In ovo - 50 g/g TDCPP 15 In vitro - 10 M TDCPP 15 In vitro - 10 M TDCPP R = 0.637 R = 0.512 20 10 -15 -10 -5 5 10 -10 In ovo - 50 g/g TDCPP 15


