The rate and molecular spectrum of spontaneous mutations in the
advertisement
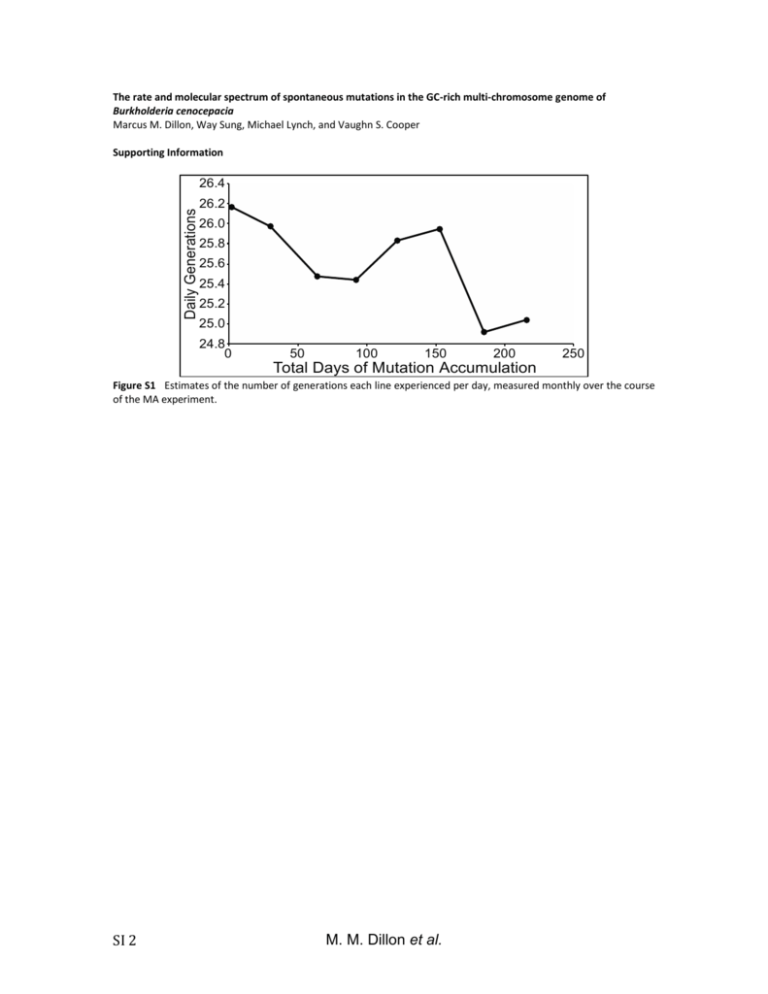
The rate and molecular spectrum of spontaneous mutations in the GC-rich multi-chromosome genome of Burkholderia cenocepacia Marcus M. Dillon, Way Sung, Michael Lynch, and Vaughn S. Cooper Supporting Information Daily Generations 26.4 26.2 26.0 25.8 25.6 25.4 25.2 25.0 24.8 0 50 100 150 200 250 Total Days of Mutation Accumulation Figure S1 Estimates of the number of generations each line experienced per day, measured monthly over the course of the MA experiment. SI 2 M. M. Dillon et al. Figure S2 Frequency distributions of the number of base substitutions (A) and indels (B) identified per line. Neither 2 = 1.81, p = 0.99; indels: 2 = 0.48, p = 0.92). distribution differs significantly from a Poisson distribution . M. M. Dillon et al. SI 3 18 Count of Identified Indels 16 14 12 10 8 6 4 2 0 0 0.2 0.4 0.6 0.8 Read Frequency of Shared Putative Insertion-Deletion Mutations 1.0 Figure S3 Distribution of the full-coverage read frequencies leading to the identification of each insertion-deletion mutation (indel) in this study. Full-coverage read frequency is the number of reads with >25 bases on each side of the indel mutation that supported the call, divided by the total reads with >25 bases on each side of the indel. SI 4 M. M. Dillon et al. Number of Insertion-Deletion Mutations 30 25 20 15 10 5 0 0 5 10 15 20 Number of Lines Identifying Each Insertion-Deletion Mutation 25 Figure S4 Distribution of the number of MA lines that identified each insertion-deletion mutation (location, size, and motif) called in this study. M. M. Dillon et al. SI 5 A OriC OriC OriC Chr1 3.48 Mb Chr2 3.00 Mb Chr3 1.06 Mb C 7 0.07 0.06 6 Evolutionary Rate (dN) Normalized Expression B 5 4 3 2 1 0.05 0.04 0.03 0.02 0.01 0 0 Chr 1 Chr 2 Chr 3 Chr 1 Chr 2 Chr 3 Figure S5 Chromosome size and expression (derived from RNAseq as described in (GOUT et al. 2013)) decline from chromosome 1 (chr1) to chromosome 3 (chr3) (A,B), while evolutionary rate is lowest on chr1 and highest on chr3 (C) (MORROW and COOPER 2012). SI 6 M. M. Dillon et al. Base Substitution Mutation Rate Per Effective Genome Per Generation (x10 -4) 10 3 10 2 10 1 Bc 10 0 10 0 10 1 10 2 10 3 10 4 Effective Population Size (x10 10 5 4) Figure S6 Relationship between base substitution mutation rate per effective genome size per generation and effective population size (NE) in five multicellular eukaryotes (red), seven unicellular eukaryotes (black), and eight prokaryotes (blue; B. cenocepacia – green) (SUNG et al. 2012). The log-linear regression is highly significant (r2=0.85, p<0.0001, df=19). M. M. Dillon et al. SI 7 Conditional Relative Substitution Rate 1.4 atpD lepA trpB 1.2 gltB phaC gyrB recA 1.0 0.8 0.6 0.4 0.2 0.0 A:T>G:C G:C>A:T A:T>T:A G:C>T:A Transitions A:T>C:G G:C>C:G Transversions Figure S7 Relative conditional substitution rates at seven B. cenocepacia loci (atpD, gltB, gyrB, lepA, phaC, recA, and trpB). Relative conditional substitution rates are estimated by assuming that the most common nucleotide at each site is ancestral and any deviation from that nucleotide is caused by a single mutation. Substitution rates were calibrated to the nucleotide content at polymorphic sites for each gene, whereby only covered sites capable of producing a given substitution are used in the denominator of each calculation. SI 8 M. M. Dillon et al. Ratio of Coding to Non-Coding Substitutions 1.0 0.8 0.6 0.4 0.2 0 C :A :A :G :G A:T G: >T :C>T T>C C>C > > T C : T : : : A G A A: G G Transitions Transversions Figure S8 The ratio of coding (Black) to non-coding (Grey) substitutions for each B. cenocepacia substitution type. M. M. Dillon et al. SI 9 File S1 SupplementaryTableS1andS2 File S1 is available for download as a .xls at SI 10 M. M. Dillon et al. References GOUT J.-F., KELLEY THOMAS W., SMITH Z., OKAMOTO K., LYNCH M., 2013 Large-scale detection of in vivo transcription errors. Proc. Natl. Acad. Sci. U. S. A. 110: 18584–9. MORROW J. D., COOPER V. S., 2012 Evolutionary effects of translocations in bacterial genomes. Genome Biol. Evol. 4: 1256–1262. RASMUSSEN T., JENSEN R. B., SKOVGAARD O., 2007 The two chromosomes of Vibrio cholerae are initiated at different time points in the cell cycle. Embo J. 26: 3124–3131. SUNG W., ACKERMAN M. S., MILLER S. F., DOAK T. G., LYNCH M., 2012 Drift-barrier hypothesis and mutation-rate evolution. Proc. Natl. Acad. Sci. U. S. A. 109: 18488–18492. M. M. Dillon et al. SI 11
