Decision Support Systems Handouts
advertisement
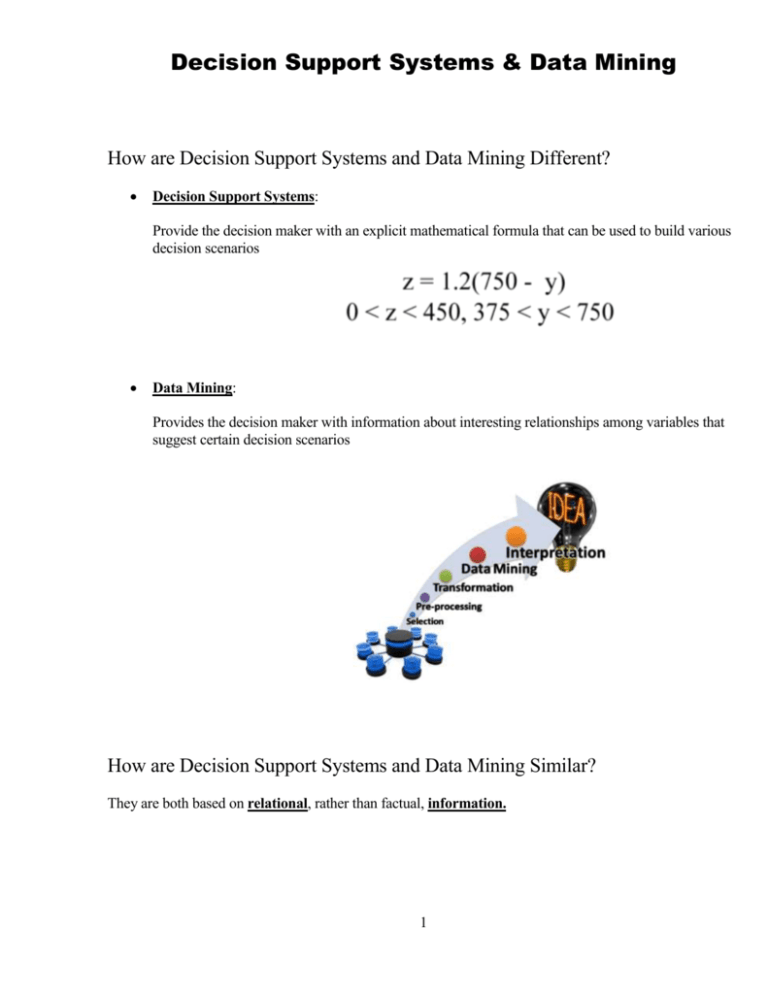
Decision Support Systems & Data Mining How are Decision Support Systems and Data Mining Different? Decision Support Systems: Provide the decision maker with an explicit mathematical formula that can be used to build various decision scenarios Data Mining: Provides the decision maker with information about interesting relationships among variables that suggest certain decision scenarios How are Decision Support Systems and Data Mining Similar? They are both based on relational, rather than factual, information. 1 What is Relational Information, and where does it come from? Factual Data Factual Information Fuel Purchase Data: date mileage #gallons Relational Information Fuel Purchase Information: MPG Proper tire pressure improves fuel efficiency Tire Pressure Adjustment data: date is related to Tire Pressure (PSI) Fuel efficiency (MPG) Model MPG = f (PSI) Mathematical Model not directly controllable directly controllable Why Build Models? To control those things that cannot be controlled directly via controlling those things that CAN be controlled directly Factual Information: What happens Relational Information: How factors underlying what happens are related 2 The Anatomy of Mathematical Models Mathematical Model Y = aX1 + bX2 + c + d Y = Dependent/Outcome Variable That which we want to control/predict, but cannot do so directly It is the outcome/consequence of other factors that we can control directly X1 , X2 = Independent/Decision/Controllable Variables Those factors that we can control directly, and whose correct values are in doubt (hence the need for a DSS) a, b, c, d = Decision Parameters, Uncontrollable Variables, Environmental Factors Those factors that affect the Dependent/Outcome Variable but cannot be controlled by the decision maker; their values are “given” in a particular situation. The Central Challenge of DSS: Given certain values of a/b/c/d, what values of X1/X2 will produce the desired value of Y? DSS ≠ DAS DSS = Decision Support Systems A system that supports/aids the decision maker; the decision is made by the decision maker semi-structured decision situations DAS = Decision Automation System A system that replaces the decision maker; the decision is delegated to the computer Fully-structured decision situations For a brief but useful textbook coverage of DSS, read An Introduction to DSS http://zimmer.csufresno.edu/~sasanr/Teaching-Material/MIS/DSS/DSS-Intro.pdf 3 The role of Intermediate Variables in facilitating the derivation of the model: PAYBACK _ + H-PRICE - R-PRICE A.19.Fuel Savings f rom Hybrid, per year A.20.Extra cost of Hybrid + H-PRICE _ _ + R-PRICE A.17. Fuel cost f or Regular, per year A.18. Fuel cost f or Hybrid, per year + + + DISTANCE/R-MPG A.15. # Gallons used f or Regular, per year _ GAS + R-MPG DISTANCE 4 A.16. # Gallons used f or Hybrid, per year _ H-MPG DISTANCE/H-MPG Using Mathematical Models 1. What-if Analysis: Given certain (hypothetical) values of the independent variables, what is the corresponding value of the dependent variable? X1 = m X2 = n Y=? 2. Goal-seek Analysis: Given a certain desired value of the dependent variable, what values of the independent variables would produce it? X1 = ? X2 = ? Y=k 3. Sensitivity Analysis: How sensitive is the dependent variable to changes in a certain independent variable when everything else is kept constant? X1 = m1 m2 m3 m4 X2 = n Y= ? ? ? ? 4. Optimization Analysis: When the independent variable should not be maximized or minimized because it involves a tradeoff, which value of it will optimize the independent variable? 5 A Case Study in Sensitivity Analysis Question: Which student’s Course Grade is more sensitive to their Term Paper Grade? Which student’s term paper should the professor read more carefully? Background: Both students S1 and S2 have met all the course requirements except the term paper (worth 10%) Student Total Score So Far (Max = 90%) S1 78% S2 82% Term Paper Grade (Max=10%) A (9-10) B (8-9) C (7-8) D (6-7) F (< 6) does not turn in Course Grade (Max = 100%) A (9-10) B (8-9) C (7-8) D (6-7) F (< 6) does not turn in Grading Scale: F D C B A _____________|_____________|_____________|_____________|_____________| 60 70 80 90 100 6 A Case Study in Optimization: T.A.C.O. – + Profit – + Revenue Expense – Number of customers likely to balk (acceptable level < 2.5%) + – Payroll Speed of Service (acceptable level < 3 m) + Parameter: Store activity level (Forecasted) + Customer-service staffing level per shift (80% of labor requirements) 7 Duration/shift Data Mining Automated discovery of patterns in large transaction-based data sets and transforming them into an understandable structure for further use Computer Models in Hollywood http://zimmer.csufresno.edu/~sasanr/Teaching-Material/MIS/DSS/computer-models-in-hollywood.pdf Script Projected ROI The System The Verdict: Decision Process Traditional approach Random selection DSS model ROI -24.4% -18.6% +5.1% Mining Consumer Data in Politics http://zimmer.csufresno.edu/~sasanr/Teaching-Material/MIS/DSS/mining-consumer-data-in-politics.pdf Life Style Variable The System Voting behavior car music drink Drug Industry Mines Physicians' Data to Boost Sales Listen to it Read it http://zimmer.csufresno.edu/~sasanr/Teaching-Material/MIS/DSS/Drug%20Industry%20Mines%20Physicians.pdf Doctor: Write Prescription prescription details Pharmacist: Fill Prescription prescription data Pharmaceutical Company: Promote Product 8
