Lab 2 - Optical Eye Diagram.
advertisement
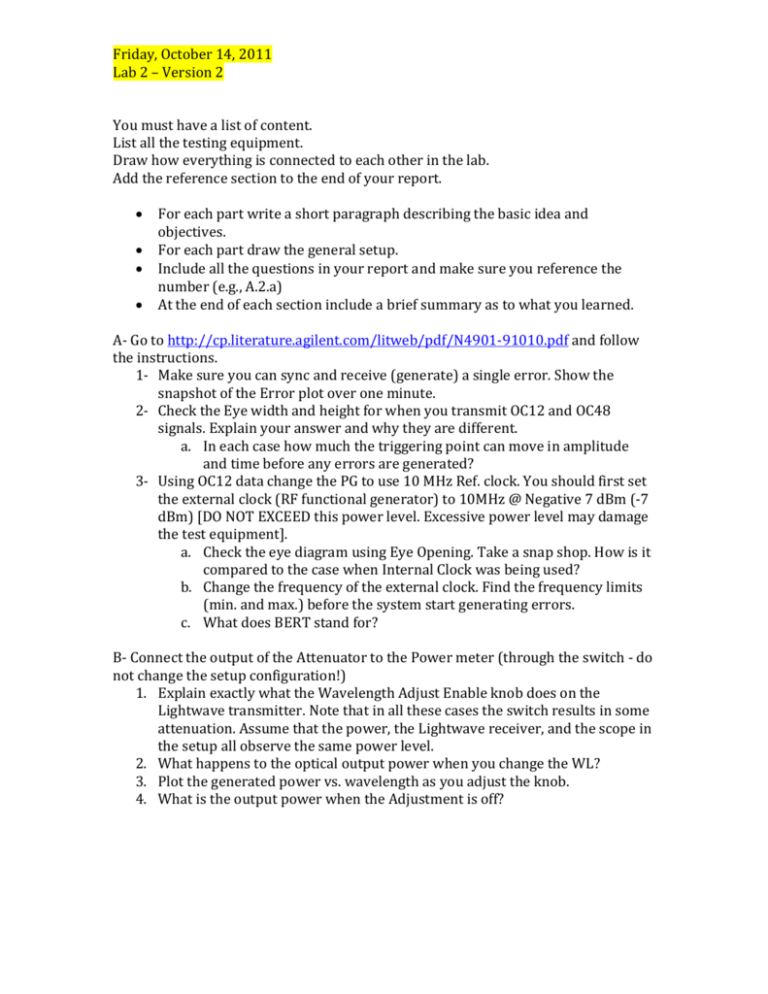
Friday, October 14, 2011 Lab 2 – Version 2 You must have a list of content. List all the testing equipment. Draw how everything is connected to each other in the lab. Add the reference section to the end of your report. For each part write a short paragraph describing the basic idea and objectives. For each part draw the general setup. Include all the questions in your report and make sure you reference the number (e.g., A.2.a) At the end of each section include a brief summary as to what you learned. A- Go to http://cp.literature.agilent.com/litweb/pdf/N4901-91010.pdf and follow the instructions. 1- Make sure you can sync and receive (generate) a single error. Show the snapshot of the Error plot over one minute. 2- Check the Eye width and height for when you transmit OC12 and OC48 signals. Explain your answer and why they are different. a. In each case how much the triggering point can move in amplitude and time before any errors are generated? 3- Using OC12 data change the PG to use 10 MHz Ref. clock. You should first set the external clock (RF functional generator) to 10MHz @ Negative 7 dBm (-7 dBm) [DO NOT EXCEED this power level. Excessive power level may damage the test equipment]. a. Check the eye diagram using Eye Opening. Take a snap shop. How is it compared to the case when Internal Clock was being used? b. Change the frequency of the external clock. Find the frequency limits (min. and max.) before the system start generating errors. c. What does BERT stand for? B- Connect the output of the Attenuator to the Power meter (through the switch - do not change the setup configuration!) 1. Explain exactly what the Wavelength Adjust Enable knob does on the Lightwave transmitter. Note that in all these cases the switch results in some attenuation. Assume that the power, the Lightwave receiver, and the scope in the setup all observe the same power level. 2. What happens to the optical output power when you change the WL? 3. Plot the generated power vs. wavelength as you adjust the knob. 4. What is the output power when the Adjustment is off? C- Make sure the PG is set to OC 192. The ED clock must be set to External. Setup the instruments as described in class. Make sure the Lightwave transmitted wavelength adjustment light is OFF. Set the PG clock to Internal. Set the input range of the ED to the following: Input Range [-1 +1], Zero Termination, Average 14mV. Make sure the RED LED on the Lightwave transmitter is ON. 1- Using BERT take a snap shot of the eye diagram and elaborate on its width and height. 2- Record ED and PG clocks as shown on the screen. 3- Can you run error free traffic? Add several errors and make sure the interface is properly working. 4- What happens if you pinch the fiber? Can you ever get the signal back? What type f error you get? 5- Under ANALYSIS click on Eye Opening. Take a snapshot of the diagram. Is the Eye Opening symmetric? Is it good or bad? 6- When you press the Error Add button, how many errors do you inject? How do you know? 7- Under PG generate 1.0E-3 BER. (you may have to press Auto Align after you clicked on Apply). a. What is the BER value displayed? b. What happened to the Eye diagram when you inject error? c. What type of error do you get (e.g., Sync Error, Bit Error)? d. What is the difference between Sync Error and Clock Error – you may have to refer to the HELP menu. e. What does it mean to generate a pattern of 2^7-1? f. What is one Error Second refer to? 8- Set the wavelength of the attenuator to the correct WL. Starting with 0 dB attenuation, increase the attenuation such that we start getting error. For each value of Attenuation, measure the Accumulated BER (under RESULTS – BER RESULTS). a. Plot your measured BER vs. the transmitted power. 9- Set attenuation to Zero. Make sure the system is working error free. 10- Redirect the signal from the Attenuator to the Optical Scope. Make sure there is no Attenuation. a. Measure the Eye diagram (height and width). Record these values. b. Take a snapshot of the Eye on the scope. 11- Read reference [1] and briefly explain what an eye diagram represents. 12- Using the PG inject 1.0E-3 BER. a. What happens to the Eye diagram on the Optical Scope. b. Take a snapshot. c. What happens if you increase the Error rate? 13- Change the attenuation of the signal. Using the Auto Scale on the scope find the eye diagram. What is happening? Take a snapshot. Explain what you see. 14- Using the patter generator button change the PG pattern to 00….101101 and show it on the scope. Make sure after changing the pattern you click on to PG&ED on the screen. a. Take a snapshot of the pattern. b. Change the pattern to 00001 and then 11111111 (all-one). Compare the output power. What happens? c. What happens if you gently pinch the fiber? D- Use Matlab to draw an eye diagram (later) References: [1] http://www.afcingenieros.com/uploads/Afc/InfoTecn/Osciloscopios/pdf/Anatomy%20of%20an% 20Eye%20Diagram%2065W26042-0%20-%20AFC.pdf [2] http://www.mathworks.com/products/communications/demos.html?file=/produc ts/demos/shipping/comm/eyemeasuredemo.html


