AP Statistics Quiz: Describing Data
advertisement
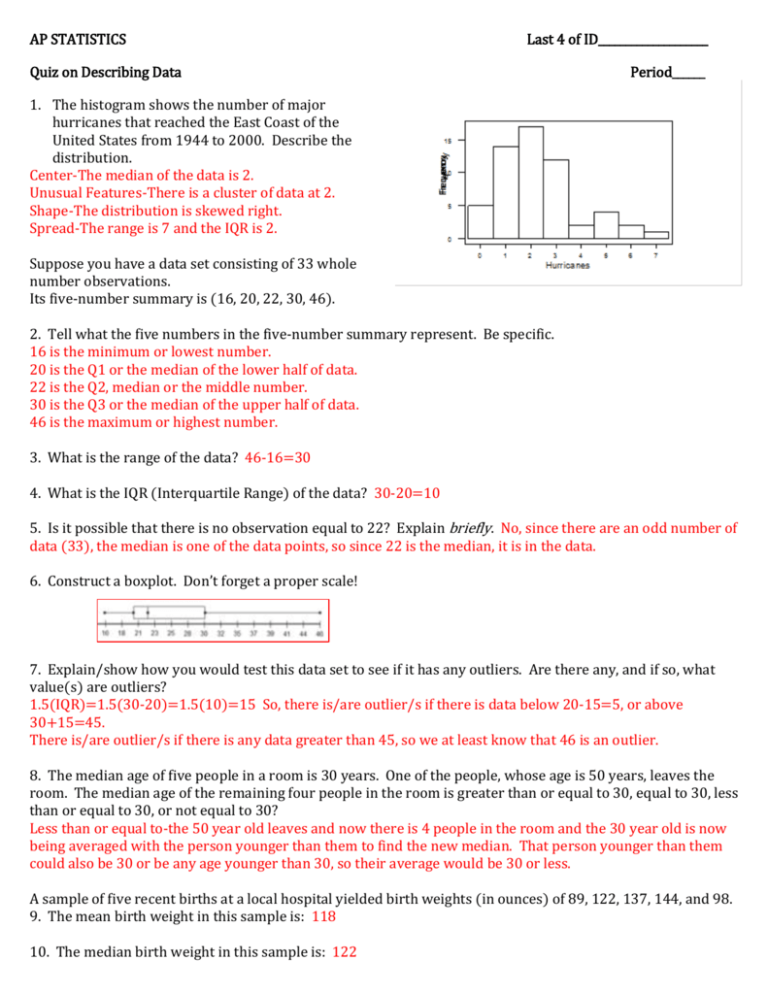
AP STATISTICS Last 4 of ID____________________ Quiz on Describing Data Period______ 1. The histogram shows the number of major hurricanes that reached the East Coast of the United States from 1944 to 2000. Describe the distribution. Center-The median of the data is 2. Unusual Features-There is a cluster of data at 2. Shape-The distribution is skewed right. Spread-The range is 7 and the IQR is 2. Suppose you have a data set consisting of 33 whole number observations. Its five-number summary is (16, 20, 22, 30, 46). 2. Tell what the five numbers in the five-number summary represent. Be specific. 16 is the minimum or lowest number. 20 is the Q1 or the median of the lower half of data. 22 is the Q2, median or the middle number. 30 is the Q3 or the median of the upper half of data. 46 is the maximum or highest number. 3. What is the range of the data? 46-16=30 4. What is the IQR (Interquartile Range) of the data? 30-20=10 5. Is it possible that there is no observation equal to 22? Explain briefly. No, since there are an odd number of data (33), the median is one of the data points, so since 22 is the median, it is in the data. 6. Construct a boxplot. Don’t forget a proper scale! 7. Explain/show how you would test this data set to see if it has any outliers. Are there any, and if so, what value(s) are outliers? 1.5(IQR)=1.5(30-20)=1.5(10)=15 So, there is/are outlier/s if there is data below 20-15=5, or above 30+15=45. There is/are outlier/s if there is any data greater than 45, so we at least know that 46 is an outlier. 8. The median age of five people in a room is 30 years. One of the people, whose age is 50 years, leaves the room. The median age of the remaining four people in the room is greater than or equal to 30, equal to 30, less than or equal to 30, or not equal to 30? Less than or equal to-the 50 year old leaves and now there is 4 people in the room and the 30 year old is now being averaged with the person younger than them to find the new median. That person younger than them could also be 30 or be any age younger than 30, so their average would be 30 or less. A sample of five recent births at a local hospital yielded birth weights (in ounces) of 89, 122, 137, 144, and 98. 9. The mean birth weight in this sample is: 118 10. The median birth weight in this sample is: 122
