Lab: Dilutions and Spectral Properties of
advertisement

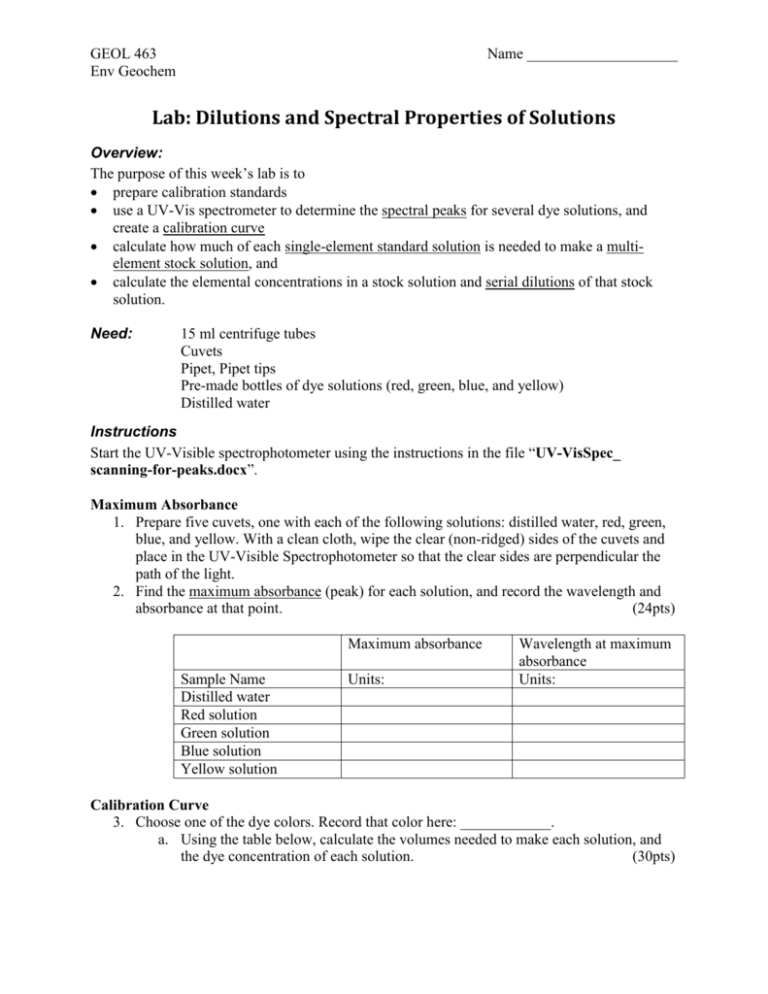
GEOL 463 Env Geochem Name ____________________ Lab: Dilutions and Spectral Properties of Solutions Overview: The purpose of this week’s lab is to prepare calibration standards use a UV-Vis spectrometer to determine the spectral peaks for several dye solutions, and create a calibration curve calculate how much of each single-element standard solution is needed to make a multielement stock solution, and calculate the elemental concentrations in a stock solution and serial dilutions of that stock solution. Need: 15 ml centrifuge tubes Cuvets Pipet, Pipet tips Pre-made bottles of dye solutions (red, green, blue, and yellow) Distilled water Instructions Start the UV-Visible spectrophotometer using the instructions in the file “UV-VisSpec_ scanning-for-peaks.docx”. Maximum Absorbance 1. Prepare five cuvets, one with each of the following solutions: distilled water, red, green, blue, and yellow. With a clean cloth, wipe the clear (non-ridged) sides of the cuvets and place in the UV-Visible Spectrophotometer so that the clear sides are perpendicular the path of the light. 2. Find the maximum absorbance (peak) for each solution, and record the wavelength and absorbance at that point. (24pts) Maximum absorbance Sample Name Distilled water Red solution Green solution Blue solution Yellow solution Units: Wavelength at maximum absorbance Units: Calibration Curve 3. Choose one of the dye colors. Record that color here: ____________. a. Using the table below, calculate the volumes needed to make each solution, and the dye concentration of each solution. (30pts) To Make Solution in Column 1 *Solution to Prepare Solution to Dilute Volume of Solution in Column (mL) distilled water (mL) Total solution (mL) Assuming the concentration of the stock dye solution is 100 dye units, give the concentration of the solution in Column 1. 1:2 stock 5 1:20 1:2 5 1:200 1:20 5 1:5 stock 5 1:50 1:5 5 * The ratio indicates the fraction of the stock dye solution. For example, the 1:2 solution has ½ the concentration of the stock solution. a. Next, using the above calculations, prepare the serial dilutions of the stock solution. (5 pts) b. Place the solutions in order from most concentrated to least concentrated. How does the dye concentration compare to color intensity? (5 pts) 4. Use the file “Quantifying a Sample on UV-Vis spec.docx” to create a calibration curve from the dilutions of the stock solution. a. Roughly sketch the calibration curve below. Is the calibration curve curved or a straight line? What equation describes this line? What is the r2 value? (10pts) b. Analyze the three unknowns provided by your instructor and record the data below. (8 pts) Sample Name Concentration (units = ) Preparing a multi-element stock solution 5. A multi-element stock solution was created by adding small volumes of single-element standards to distilled water (see the table on the next page). Use the data in the table to make the following calculations. a. Calculate the volume of each single-element standard solution that was added to create the stock solution. (Hint: use the mass and density.) (3 pts) b. Calculate the total volume of the stock solution; record on the table. (2 pts) c. Calculate the concentration of each element in the stock solution. (4 pts) d. Calculate the concentrations of the solutions made from dilutions of the stock standard. For example, elemental concentrations in a 1:10 dilution of the stock solution are 1/10th the concentration of the stock solution. (9 pts) Element Density of original standard soln Conc of original standard soln Mass of standard soln used to make stock soln g/ml mg/l g Al 1.0600 10,000 5.000 Ca 1.0373 10,000 4.000 Fe 1.0546 10,000 2.500 K 1.0206 10,000 4.000 Mg 1.0051 1,000 5.000 Na 1.0207 10,000 2.200 P 1.0030 1,000 5.000 Si 1.0372 10,000 2.500 Sr 1.0222 1,000 0.600 Distilled water Total Stock Soln 1.0000 69.00 100.00 Elemental concentrations in the dilutions of the stock solution Volume of standard soln used to make stock soln Conc in stock soln mL mg/L 1/100 1/50 (mg/L) 1/10 1/5


