HydrolFluv - University of Colorado Denver
advertisement
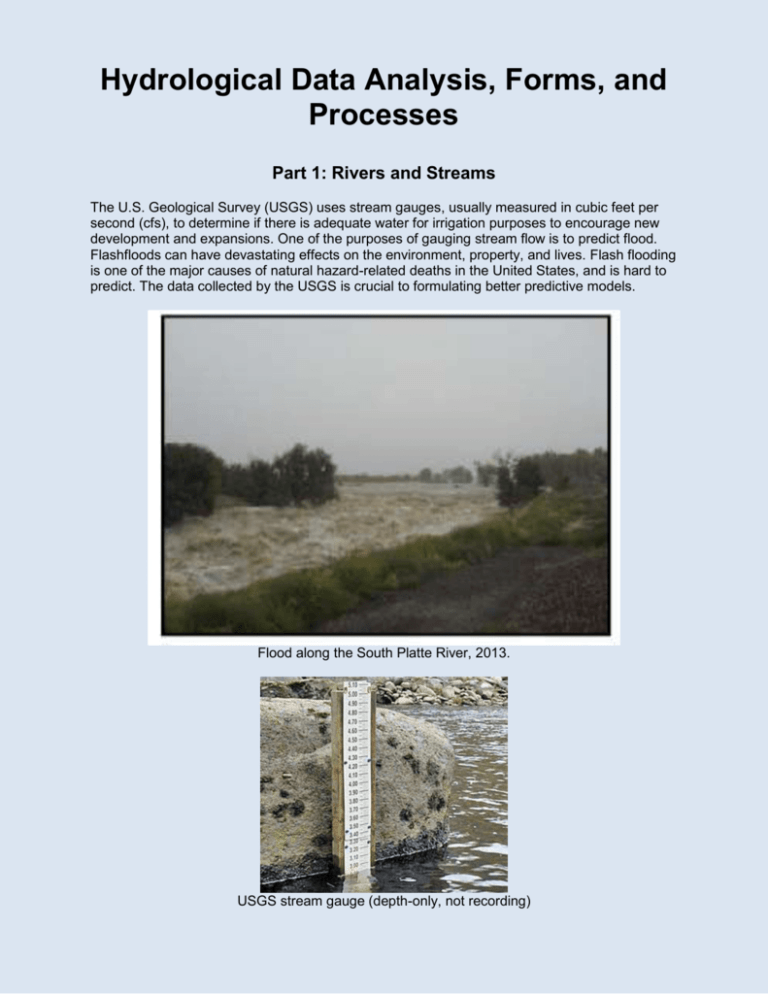
Hydrological Data Analysis, Forms, and Processes Part 1: Rivers and Streams The U.S. Geological Survey (USGS) uses stream gauges, usually measured in cubic feet per second (cfs), to determine if there is adequate water for irrigation purposes to encourage new development and expansions. One of the purposes of gauging stream flow is to predict flood. Flashfloods can have devastating effects on the environment, property, and lives. Flash flooding is one of the major causes of natural hazard-related deaths in the United States, and is hard to predict. The data collected by the USGS is crucial to formulating better predictive models. Flood along the South Platte River, 2013. USGS stream gauge (depth-only, not recording) Task 1: Flood and Run-off A. How do flash flood occur? Also, explain how flash floods affects areas with low infiltration capacity vs. high infiltration capacity. B. During or shortly after a precipitation event, what is the expected run-off event in forested and urban environment? Draw run-off curves for each environment (below) and annotate each to display your understanding of how overland flow changes due to surface type. Discharge (cfs) Forested Time Discharge (cfs) Urban Time Task 2: Stream Order and Drainage Basin Streams and rivers are relatively hydrodynamic compared to lakes. In a fluvial geomorphic view, the stream system includes all surface waters in the watershed that form a network of tributary channels and the main-stem channel. Characterizing streams in stream-order is a way to quantify the network of streams. First-order stream consist of the headwater tributaries starting as a single channel. When two first-order streams join, then it becomes second-order stream. However, if a first-order stream joins a second-order, it remains a second-order stream. When two second-order streams join, they become a third-order stream, and so on, as displayed in this image, known as the Horton-Strahler method: There are several varieties of stream ordering methods that are being used today. The HortonStrahler stream ordering method is the most common and most widely used method. A. Identify the stream orders according to the Horton-Strahler stream-order method. Place the corresponding stream-order numbers in the circle next to each stream. Task 3: Drainage Basin (Watershed) A drainage basin, or watershed, is an area where all tributaries drain downslope into a body of water such as river, lake, reservoir, wetland, or ocean. In the U.S., a majority of the States have more than one hydrological unit or watershed. Within the main watershed, there are smaller watersheds that drain into larger rives. For example, in this old National Atlas image, Utah has three watersheds belonging to the: Lower Colorado, Great Basin, and California watersheds: Search the web, and then answer these questions. A. How many drainage basins does Colorado have and what are they? (Provide an image with URL citation to support your answers). B. What does this say about the geomorphology of Colorado? Part 2: Stream Flow and Precipitation Data Analysis In September 2013, massive flood took place in Colorado. The moist air from the Gulf of Mexico became trapped up against the mountains, and precipitated over the Northern Rockies region causing severe devastation to the communities. The heavily precipitation event continued for seven days from the 9th -15th of September. The Urban Drainage and Flood Control District recorded the rain accumulation averaging 20 inches at one of the gauge sites in Denver Metro area located along the South Platte River. History: The South Platte River is one of the two principal tributaries of the Platte River and itself a major river of the American West, located in the U.S. states of Colorado and Nebraska. Its drainage basin includes much of the eastern flank of the Rocky Mountains in Colorado; much of the populated region of the Colorado Front Range and Eastern Plains; and a portion of southeastern Wyoming in the vicinity of the city of Cheyenne. The September 2013 storm event caused rivers and channels to flood all across Colorado, and South Platte River was one of the rivers that carried large amount of water through the Denver Metro area. The daily average discharge of the South Platte River in August 2013 recorded by USGS flow gauge was 197.6 cubic feet per second (cfs). NOTE: Chatfield Reservoir releases excess water downstream to South Platte River during increase in water level in the reservoir The USGS flow gauge is located at I-25 and 20th street: USGS gauge station.png Task 1: Stream Flow Data Analysis 1. For the this task, go to: http://www.dwr.state.co.us/Surfacewater/data/detail_graph.aspx?ID=PLADENCO&MTY PE=DISCHRG 2. Under Tabular Data on the right-hand side, and select the September 9th through 15th, 2013. 3. Uncheck the “GAG_HT” box and click “View Data”. 4. Click the Daily Ave (Flow data analysis .jpg) 5. View Data: This will show you the Data/time and Discharge values in CFS. 6. Fill out the below table with the values. Date Discharge (cfs) 9/9/2013 9/10/2013 9/11/2013 9/12/2013 9/13/2013 9/14/2013 9/15/2013 Average Discharge: Maximum Discharge: As a scientist, you must analyze and interpret the data results. Compare the results from 0915 September 2013 to 09-15 August 2013 average discharge value. Since you weren’t around the gaging station in September 2013, what could you surmise was occurring then, as opposed to the month previous (August 2013)? Explain possible reasons for your interpretations? Task 2: Precipitation Data Analysis For this task, you will make a graph showing the rain events by plotting the September, 2013 flow (discharge) data and precipitation data which is provided by the Urban Drainage and Flood Control District’s website. (https://udfcd.onerain.com/sensor.php?device_id=6&site_id=14357&view_id=296&tz=US%2FM ountain&mode=datepicker&data_start=2013-09-09+00%3A00%3A00&data_end=2013-0915+00%3A00%3A00&submit_date=OK&hours=0) 1. You will use the same storm event dates and values you got from the previous task. 2. Next, retrieve the precipitation data from: Precipitation Data_Student data.xlsx As you can see, the data is composed of precipitation increments that the rain gauge records several times a day. For this task, you will draw vertical lines to plot the data on the top part of the graph for each data points. (Hint: as you draw vertical lines next to each other, it will become thicker indicating continuous rain) Then you will use the discharge data you already have to draw a line graph on the bottom part of the graph. 3. Plot the data on graph. In Example A, precipitation is plotted on tas vertical bars above the horizontal line. Discharge is plotted as a curve, based on the gaging station readings. Precip. (in) 0.00 0.05 0.10 1400 Discharge (cfs) 1200 1000 800 600 400 200 0 7/12/13 7/13/13 7/14/13 7/15/13 Example A. Sample data plot. Precip. (in) South Platte River at Denver 0.00 0.05 0.10 0.15 0.20 3000 Discharge (cfs) 2750 2500 2250 2000 1750 1500 1250 1000 750 500 250 0 9/9/13 9/10/13 9/11/13 9/12/13 9/13/13 9/14/13 9/15/13 Plot your data on this graph. What can you tell by looking at the precipitation events and discharge amounts? Are there any correlations? Explain why or why not? Part 3: Paleo Rivers The current position of the rivers (and the formation of the Great Lakes) in the Northern Hemisphere was directly influenced by the extent of glaciation during the Pleistocene Epoch. This article explores the dramatic effect glaciation had on the course of major rivers in North America and Europe and how history was shaped by these features. Read this article: http://www.uwgb.edu/dutchs/research/what-if/whatif.htm A. Can you think of your own examples of how history would have been affected by these changes? B. Using examples from the article as models, how do you think North American and Europe would be affected now if the next ice age began? Give TWO good examples/scenarios for each continent and provide sufficient support. Example 1: Example 2: Part 4: Lake Formation and Types Lakes are just as ecologically important as rivers with their own unique geological history. A lake is a very slowly flowing open body of water in a depression in the ground that is not in contact with the ocean. Therefore, it is important to discuss what exactly can cause there to be a depression in the ground. There are 4 main forces that lead to depression that fill with water and form lakes. 1. Tectonic Movements Lakes formed by tectonic activity are usually deeper and older than other lakes. These lakes are formed along fault lines when blocks slip below other blocks or tilt, forming depressions. Graben lakes, like Lake Baikal in Russia, are formed when a blocks slips below the level of the blocks on either side. Horst lakes are formed when a fault block tilts along fault lines and leave a depression. Horst and graben structures are indicative of tensional forces and crustal stretching. These lakes are found in areas of tectonic activity or along fault lines. Graben Lake (left) and Hosrt Lake (right). 2. Glacial Activity Glaciation scours the landscape and leaves behind many different types of depressions that become lakes. Glacial lakes tend to be the largest lakes and are most abundant in high latitudes in the Northern Hemisphere that were glaciated during the Pleistocene Epoch. Tarns are lakes formed by glacial scraping out of cirques, and found high up in the mountains. They most always have a headwall and are found in an amphitheater-shaped area. Fjord lakes are formed in steep glacial valley when the outwash river that would normally go to the ocean or sea is blocked by ice, till, landslide, or some other mass wasting event. Note: a fjord lake is different that a fjord because a fjord has an outlet to the sea or ocean. Kettle lakes form as a glacier recedes and the ice inside the glacial till eventually melts. These are continental glaciation features and therefore found at glacial margins (or previous glacial margins) such as the Mid-West of the US, Upstate New York, and Scandinavia. Terminal and lateral moraine lakes form when moraine till dams the outwash. 3. Volcanic Activity Lakes formed by volcanic activity tend to be relatively small. Lakes may form within the crater of an active but quiet volcano, in a caldera produced by explosion and collapse of an underground magma chamber, on collapsed lava flows, and in valleys dammed by volcanic deposits. 4. Erosion and Dissolution In karst regions, the limestone under the surface can dissolve and erode over time. Sinkholes (or dolines) can form in these areas easily. Overtime, sinkholes fill in and become lakes. They are usually small, but can be deep. Sometimes these sinkholes form under lakes and drain them. Task 1: Digital Landform Analysis Now that you have a basic understanding of lake formation, look at these pictures and try to determine what type of lake they represent. A. What type of lake is this and how did it form? B. What type of lake is this, and how did it form? How can you tell it’s not another type of circular mountain lake? C. What kind of lakes are these, and how could have they formed? What other types of landforms could be found in the area based on how these lakes were formed? D. Why type of lake is this, and how could it have been formed? Explain how you came to this conclusion. E. What kind of lake is this? Describe the process that formed this lake. F. Based on this topographic map above, can you tell what kind of lake this is? Describe how you came to this conclusion based on this map. Task 2: Online Research A. Lake Vostok is a very unique lake. Do some research and find out what makes this lake so unique. Include a discussion of how it was formed. Do not copy and paste/plagiarize. Put in your own words. B. Pick two types of previously unmentioned lakes and describe how they are formed. Include a diagram or a photo of an example of the type of lake you chose. Do not copy and paste/plagiarize. Put in your own words. C. Lakes are important sources of past climate information for paleoclimatologists. Explain how lakes are used to help determine past climate and which type of lake would most likely be used for these studies. Do not copy and paste/plagiarize. Put in your own words.


