Table S1. Oligo sequences shown in 5´ to 3´ orientation L1
advertisement
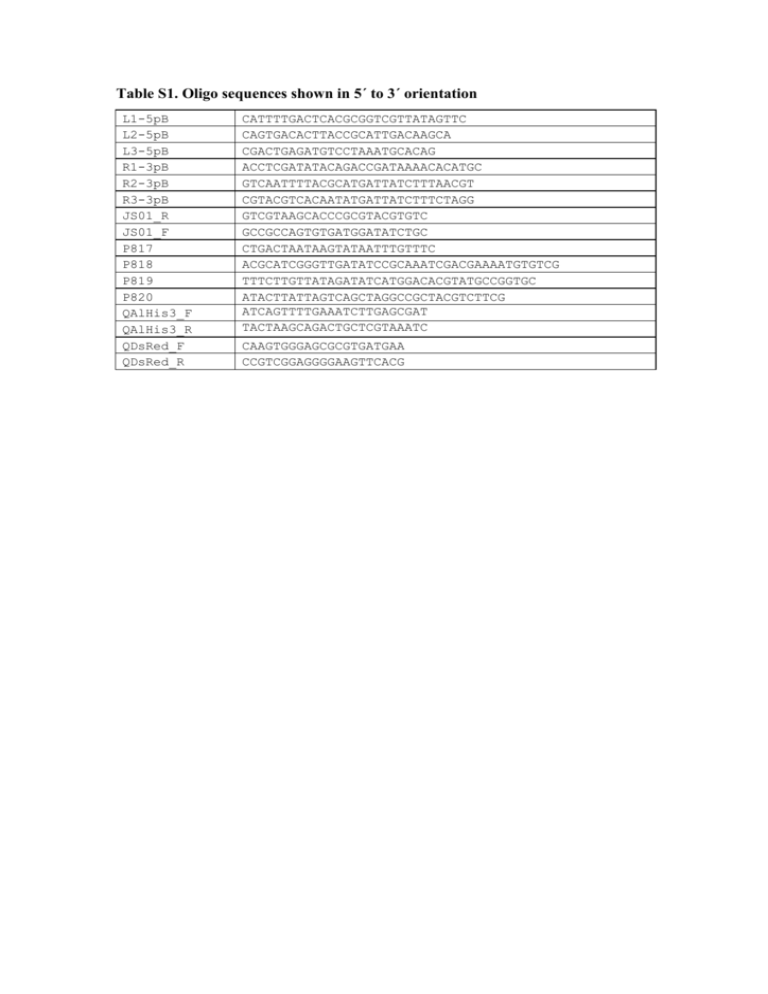
Table S1. Oligo sequences shown in 5´ to 3´ orientation L1-5pB L2-5pB L3-5pB R1-3pB R2-3pB R3-3pB JS01_R JS01_F P817 P818 P819 P820 QAlHis3_F QAlHis3_R QDsRed_F QDsRed_R CATTTTGACTCACGCGGTCGTTATAGTTC CAGTGACACTTACCGCATTGACAAGCA CGACTGAGATGTCCTAAATGCACAG ACCTCGATATACAGACCGATAAAACACATGC GTCAATTTTACGCATGATTATCTTTAACGT CGTACGTCACAATATGATTATCTTTCTAGG GTCGTAAGCACCCGCGTACGTGTC GCCGCCAGTGTGATGGATATCTGC CTGACTAATAAGTATAATTTGTTTC ACGCATCGGGTTGATATCCGCAAATCGACGAAAATGTGTCG TTTCTTGTTATAGATATCATGGACACGTATGCCGGTGC ATACTTATTAGTCAGCTAGGCCGCTACGTCTTCG ATCAGTTTTGAAATCTTGAGCGAT TACTAAGCAGACTGCTCGTAAATC CAAGTGGGAGCGCGTGATGAA CCGTCGGAGGGGAAGTTCACG Table S2. Phenotype segregation analysis of TTSSs. Progeny from backcrosses of one G1 transgenic male to three WT Moscafrut females were screened and sorted by sex and marker expression. Significant difference is achieved if P < 0.05. TTSS Transformed flies male female Wild type flies male female Total Chi-square (1:1) P-value attP_M1 44 32 25 20 121 7.94 0.005 attP_M3 38 42 24 19 123 11.13 0.001 attP_M6 28 29 30 26 113 0.008 0.925 attP_2-M6y 87 0 0 81 168 ---- ---- attP_M12 41 38 21 20 120 12.03 0.001 attP_M13 30 33 34 32 129 0.069 0.795 attP_M19 31 24 36 35 126 2.03 0.154 attP_M21 43 39 16 12 110 26.50 <0.001 attP_F1 28 31 6 8 73 27.73 <0.001 attP_F1x 0 68 60 0 128 --- attP_F7 49 45 46 49 189 0.008 0.942 attP_F20 64 67 35 31 197 21.44 <0.001 attP_F21 38 36 35 32 141 0.34 0.556 Table S3. Life cycle analysis of TTSS. Average transition frequencies (Pi), permanence of females to the generational overlap (S5), and mean net fecundity per female (F5) were calculated. Numbers are based on an initial cohort of 100 eggs (Mean±SD; P=0.05, n=10). The first analysis compared TTSS to WT, the second analysis compared WT strains to TTSS and SSIS. First analysis P1 P2 P3 P4 S5 F5 WT (Chiapas) 0.92±0.01 a* 0.81±0.10 ab 0.97±0.02 a 0.95±0.05 a 0.80±0.10 a 4091 ± 22 a attP_M6 0.72±0.05 c 0.74±0.18 ab 0.97±0.02 a 0.91±0.05 ab 0.70±0.10 a 2613 ± 17 b attP_2-M6y 0.91±0.02 a 0.68±0.07 b 0.98±0.02 a 0.92±0.03 a 0.70±0.10 a 3902 ± 23 a attP_M13 0.76±0.06 bc 0.65±0.16 b 0.99±0.01 a 0.89±0.06 ab 0.70±0.10 a 2540 ± 45 b attP_M19 0.80±0.04 b 0.82±0.09 ab 0.97±0.02 a 0.90±0.11 ab 0.73±0.11 a 2342 ± 19 b attP_F1x 0.76±0.06 bc 0.76±0.08 ab 0.97±0.02 a 0.91±0.04 ab 0.66±0.05 a 2944 ± 19 b attP_F7 0.92±0.03 a 0.85±0.09 a 0.93±0.03 b 0.83±0.05 b 0.80± 0.00 a 4132 ± 23 a attP_F21 0.81±0.06 b 0.75±0.11 ab 0.97±0.02 a 0.94±0.05 a 0.76±0.05 a 3034 ± 13 b WT (Chiapas) 0.93±0.02 ab 0.79±0.10 a 0.98±0.03 a 0.93±0.03 ab 0.82±0.04 a 3613 ± 157 a attP_2-M6y Second analysis 0.91±0.02 abc 0.72±0.04 ab 0.98±0.01 a 0.93±0.02 ab 0.80±0.04 a 3603 ± 121 a int_2-M6y 0.95±0.01 a 0.82±0.07 a 0.99±0.01 a 0.90±0.04 b 0.76±0.04 a 3539 ± 166 ab attP_F7 0.89±0.05 bc 0.74±0.09 a 0.98±0.01 a 0.96±0.03 a 0.80±0.04 a 3415 ± 74 b int_F7 0.87±0.05 c 0.63±0.09 b 0.95±0.02 a 0.94±0.03 ab 0.62±0.04 c 1885 ± 157 c *Letters denote the level of significant difference, with no difference among values with common letters Figure S1. Comparison of heterozygous and homozygous females from the A. ludens transgenic target site strain attP_F7. Adult females of attP_F7 are shown under brightfield (A) and epifluorescence using the TXR filter (B). The heterozygous female (left) shows a weaker DsRed intensity compared to the homozygous female (right). Heterozygous and homozygous conditions were verified by segregation analysis through backcrosses to WT. Figure S2. Relative expression of DsRed transcript in A. ludens strains. DsRed expression was compared by quantitative PCR on cDNA generated from adult flies. Relative accumulation of DsRed transcript normalized against AlHis3 transcript using the strain attP_2-M6y as a calibrator is shown. Error bars show the S.E., with the mean fold change from three independent experiments shown above.
