Lab 8: Spatial, Spectral and Radiometric Resolution
advertisement

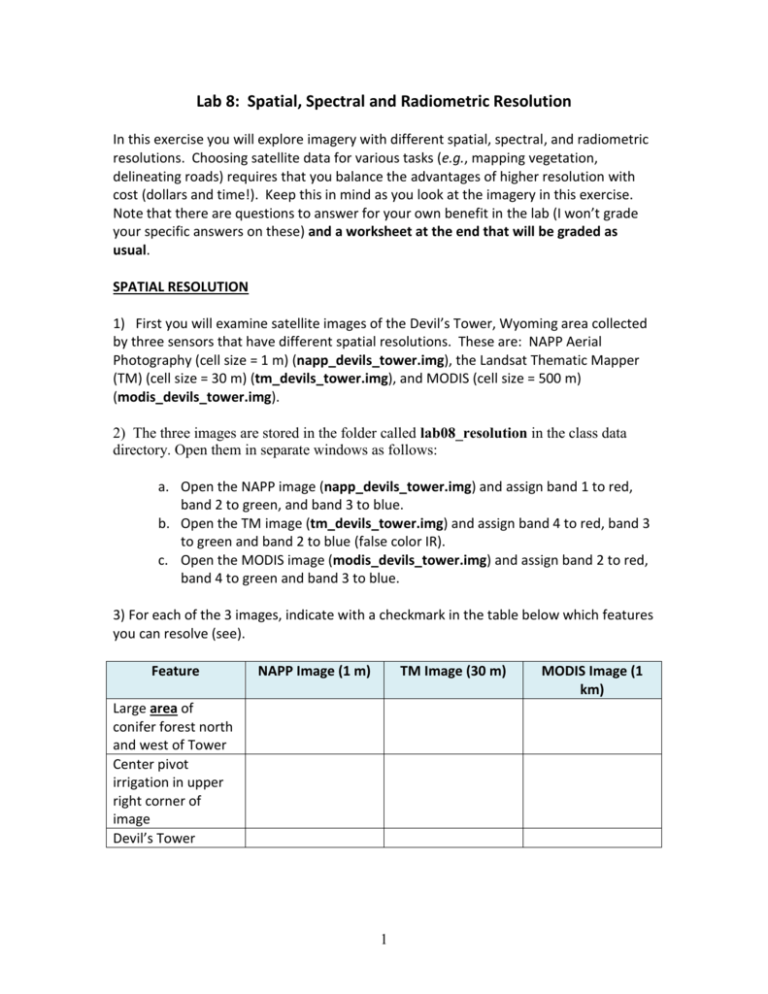
Lab 8: Spatial, Spectral and Radiometric Resolution In this exercise you will explore imagery with different spatial, spectral, and radiometric resolutions. Choosing satellite data for various tasks (e.g., mapping vegetation, delineating roads) requires that you balance the advantages of higher resolution with cost (dollars and time!). Keep this in mind as you look at the imagery in this exercise. Note that there are questions to answer for your own benefit in the lab (I won’t grade your specific answers on these) and a worksheet at the end that will be graded as usual. SPATIAL RESOLUTION 1) First you will examine satellite images of the Devil’s Tower, Wyoming area collected by three sensors that have different spatial resolutions. These are: NAPP Aerial Photography (cell size = 1 m) (napp_devils_tower.img), the Landsat Thematic Mapper (TM) (cell size = 30 m) (tm_devils_tower.img), and MODIS (cell size = 500 m) (modis_devils_tower.img). 2) The three images are stored in the folder called lab08_resolution in the class data directory. Open them in separate windows as follows: a. Open the NAPP image (napp_devils_tower.img) and assign band 1 to red, band 2 to green, and band 3 to blue. b. Open the TM image (tm_devils_tower.img) and assign band 4 to red, band 3 to green and band 2 to blue (false color IR). c. Open the MODIS image (modis_devils_tower.img) and assign band 2 to red, band 4 to green and band 3 to blue. 3) For each of the 3 images, indicate with a checkmark in the table below which features you can resolve (see). Feature NAPP Image (1 m) TM Image (30 m) Large area of conifer forest north and west of Tower Center pivot irrigation in upper right corner of image Devil’s Tower 1 MODIS Image (1 km) Feature NAPP Image (1 m) TM Image (30 m) MODIS Image (1 km) Belle Fourche River (runs from lower center to upper right) Individual trees Cars in parking lot just west of Tower Can you see features that are narrower or smaller than the size of a pixel (e.g., is a road that is less than 30 m wide visible in the TM image?)? If so, why do you think this would be? Based just on differences in spatial resolution, what types of applications might each satellite (NAPP, TM, MODIS) be good for? How many NAPP pixels fit in a TM pixel? In a MODIS pixel? Remember that the resolution (e.g., 30 m for TM) is the dimension of one edge of a pixel (draw a diagram if necessary). Use the Windows Explorer to look at the file size of each of these images on the computer. How do the file sizes compare? Why? 2 SPECTRAL RESOLUTION Spectral resolution can be described as either the number of spectral “bands” recorded by a particular instrument, or as the range of wavelengths (bandwidth) covered by each band. Usually we use the former description (# of bands) and usually more bands goes with narrower ranges of wavelength in each band. In this part of the lab, you will compare spectral signatures generated from Devil’s Tower imagery that has 3 different spectral resolutions: 1) NAPP photography with 3 bands (Green, Red, NIR), 2) Landsat TM imagery with 6 reflective bands (Blue, Green, Red, NIR, MIR1, MIR2) and 3) AVIRIS hyperspectral imagery with 63 bands (reduced from 224 in original AVIRIS imagery). Open the NAPP image as you did in the first section (RGB = Bands 1,2,3). In a separate viewer open the TM image as you did previously (RGB = Bands 4,3,2). In a third viewer, open the AVIRIS image (dev_tower_aviris.img) as RGB = Bands 63,20,2). Note that the orientation of the AVIRIS image is rotated from that of the other images…be careful to pay attention to this when finding similar areas. For each image you will use the spectral profile tool to look at and compare spectral signatures generated using the 3 images. Do this using the crosshair in each Spectral Profile window to click on an area that you want to examine spectrally. First, find an area of lush vegetation (red in these images) (e.g., the center pivot irrigation in the upper right of the images. Generate 3 spectral curves, one for each image. Can you see the shape of the classic vegetation reflectance curve in the graph you created for the NAPP data (note that band 1 = NIR, band 2 = red and band 3 = green in this image, so mentally translate the curve accordingly!)? What are the important characteristics of this curve at this spectral resolution?? How about in the curve from the TM image? Can you make out the general shape of the spectral response of green vegetation? How about the curve from the AVIRIS data? Can you see the shape of the typical vegetation spectrum? How does this curve compare to one measured in a laboratory that is included on the next page? 3 The above is a high spectral resolution reflectance spectra for lawn grass. I downloaded this from a spectral library on the web (http://speclab.cr.usgs.gov/spectral.lib04/spectral-lib.desc+plots.html) What do the deep dips in reflectance (wavelengths 1.5 um and 2.0 um) represent? Can you see these dips in the AVIRIS curve you generated? Why or why not? How about in the TM curve? What might be some implications of this for a farmer who wanted to use remote sensing as a tool for monitoring his or her crops? 4 RADIOMETRIC RESOLUTION For the last part of this exercise you will practice calculating the amount of storage space required on a computer hard drive to store imagery that has different radiometric resolutions. TURN IN THE WORKSHEET ON THE FOLLOWING PAGE. Work on this individually! You can turn in your answers on your own paper if you want or you can print the page of the lab and turn it in. The following information is necessary to complete the exercise: One 1-bit to one 8-bit digital number (DN) requires 1 byte to store on a hard drive. One 9-bit to one 16-bit digital number (DN) requires 2 bytes to store on a hard drive. Each pixel in each band requires a single digital number (DN) that has the “bit depth” (number of bits) specified for that sensor. Each pixel covers an area on the ground that is the square of the stated spatial resolution (e.g., a 30 m TM pixel covers a 30 m x 30 m = 900 m2 area) 5 Name____________________________ Lab 8: Resolution Worksheet 1. How many Landsat pixels are found in a square area that is 3 km on each side? 2. How many DNs would there be for the area above if the Landsat image has 6 bands? 3. If the Landsat sensor is an 8-bit sensor, how many bytes are required to store the 6-band image on a hard drive? 4. If the Landsat sensor described above (30 m pixels; 6 bands; area 3 km on a side) were an 11-bit sensor, how many bytes would be required to store the image on a hard drive? 6


