Statistics PRO
advertisement
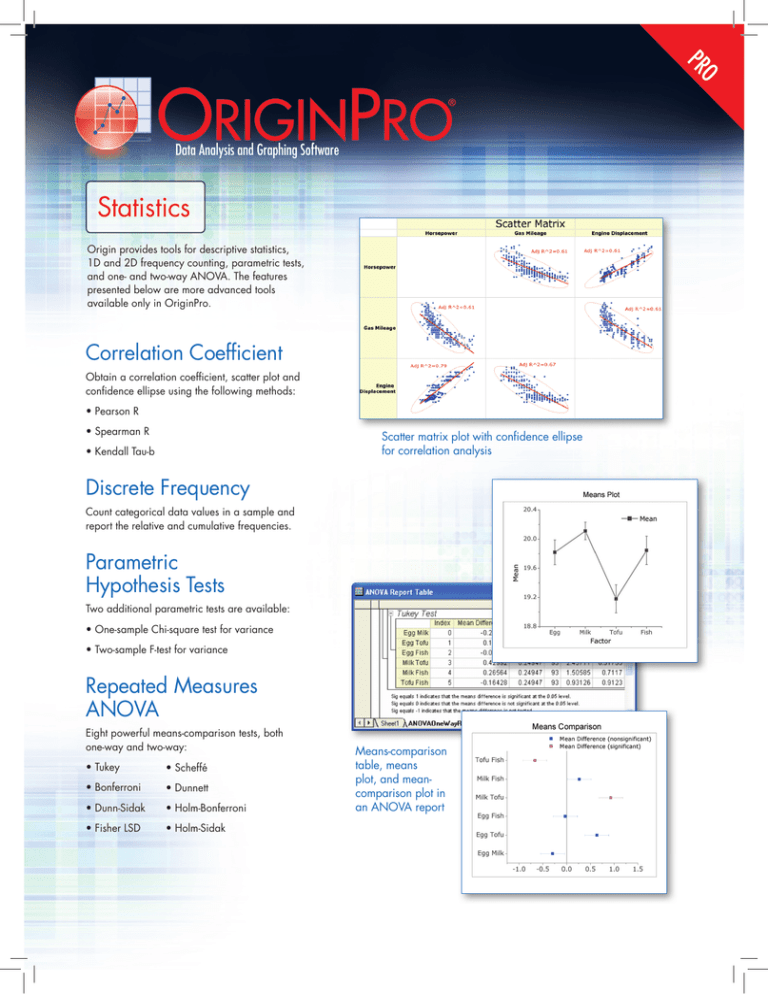
O PR Statistics Origin provides tools for descriptive statistics, 1D and 2D frequency counting, parametric tests, and one- and two-way ANOVA. The features presented below are more advanced tools available only in OriginPro. Correlation Coefficient Obtain a correlation coefficient, scatter plot and confidence ellipse using the following methods: •P earson R •S pearman R Scatter matrix plot with confidence ellipse for correlation analysis •K endall Tau-b Discrete Frequency Count categorical data values in a sample and report the relative and cumulative frequencies. Parametric Hypothesis Tests Two additional parametric tests are available: •O ne-sample Chi-square test for variance • T wo-sample F-test for variance Repeated Measures ANOVA Eight powerful means-comparison tests, both one-way and two-way: • T ukey • Scheffé •B onferroni • Dunnett •D unn-Sidak • Holm-Bonferroni • F isher LSD • Holm-Sidak Means-comparison table, means plot, and meancomparison plot in an ANOVA report O PR Nonparametric Tests Several nonparametric tests are available, including: • One-Sample Wilcoxon Signed Rank • Paired-Sample Sign • Paired-Sample Wilcoxon Signed Rank • Two-Sample Kolmogorov-Smirnov • Mann-Whitney • Kruskal-Wallis ANOVA • Mood’s Median • Friedman ANOVA Power and Sample Size Compute power given sample size, or sample size given power. Survival function plots Survival Analysis Choose from three widely used survival analysis functions: •K aplan-Meier product-limit estimator, with three equality test methods - Log-rank - Breslow - Tarone-Ware • Cox Proportional Hazards Model • Weibull Fit Model ROC Curves Create Receiver Operating Characteristic (ROC) curves, summarizing the trade-off between falsenegative and false-positive rates for all possible cutoff values. ROC curve comparing two samples www.originlab.com


