3653grading3619
advertisement
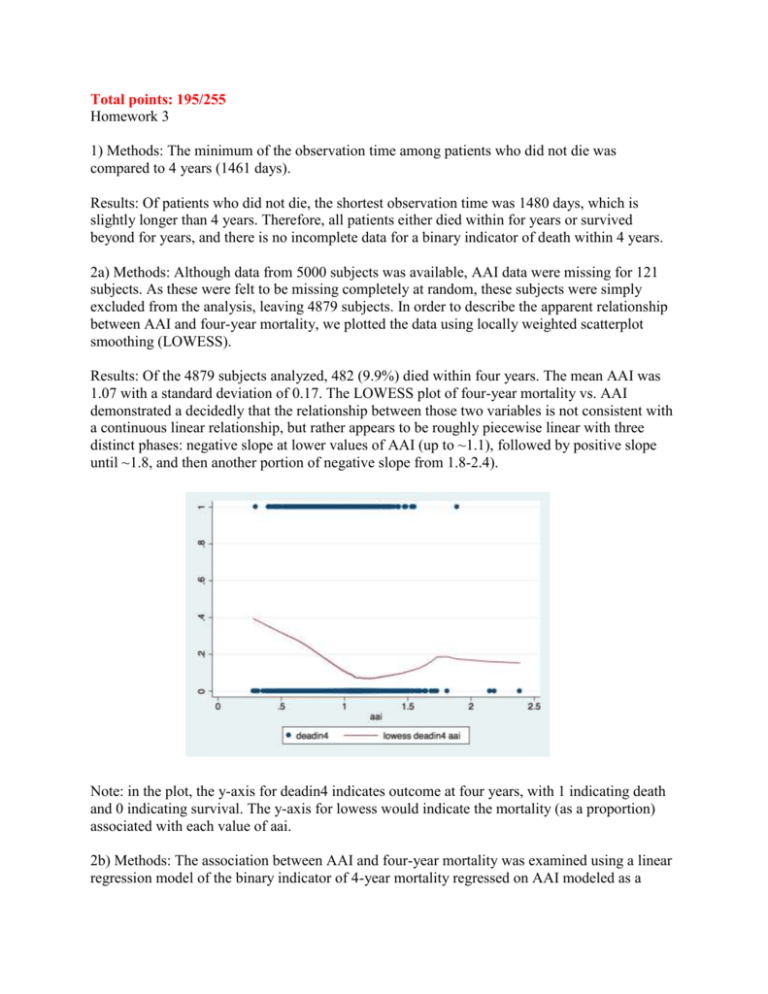
Total points: 195/255 Homework 3 1) Methods: The minimum of the observation time among patients who did not die was compared to 4 years (1461 days). Results: Of patients who did not die, the shortest observation time was 1480 days, which is slightly longer than 4 years. Therefore, all patients either died within for years or survived beyond for years, and there is no incomplete data for a binary indicator of death within 4 years. 2a) Methods: Although data from 5000 subjects was available, AAI data were missing for 121 subjects. As these were felt to be missing completely at random, these subjects were simply excluded from the analysis, leaving 4879 subjects. In order to describe the apparent relationship between AAI and four-year mortality, we plotted the data using locally weighted scatterplot smoothing (LOWESS). Results: Of the 4879 subjects analyzed, 482 (9.9%) died within four years. The mean AAI was 1.07 with a standard deviation of 0.17. The LOWESS plot of four-year mortality vs. AAI demonstrated a decidedly that the relationship between those two variables is not consistent with a continuous linear relationship, but rather appears to be roughly piecewise linear with three distinct phases: negative slope at lower values of AAI (up to ~1.1), followed by positive slope until ~1.8, and then another portion of negative slope from 1.8-2.4). Note: in the plot, the y-axis for deadin4 indicates outcome at four years, with 1 indicating death and 0 indicating survival. The y-axis for lowess would indicate the mortality (as a proportion) associated with each value of aai. 2b) Methods: The association between AAI and four-year mortality was examined using a linear regression model of the binary indicator of 4-year mortality regressed on AAI modeled as a linear continuous variable. The difference in 4-year mortality associated with a single-unit difference in AAI was provided by the regression coefficient for the AAI variable, calculated using robust standard errors in order to account for the heteroscedasticity of binary outcome variables. Two-sided p-values and 95% confidence intervals were computed assuming the asymptotic normal distribution for the linear regression parameter estimates. Results: Our results demonstrated a significant association between AAI and four-year-mortality (p < 0.001); specifically, a one-unit increase in AAI was associated with an absolute difference in four-year mortality of -28.4% (95% CI: -34.7% – -22.2%). 2c) Methods: The association between AAI and four-year mortality was examined using a linear regression model of the binary indicator of 4-year mortality regressed on AAI modeled as the log-transformed continuous variable. The difference in 4-year mortality associated with a singleunit difference in log-AAI was provided by the regression coefficient for the log-AAI variable, calculated using robust standard errors in order to account for the heteroscedasticity of binary outcome variables. Two-sided p-values and 95% confidence intervals were computed assuming the asymptotic normal distribution for the linear regression parameter estimates. Results: Our results demonstrated a significant association between log-AAI and four-yearmortality (p < 0.001); specifically, a one-unit increase in log-AAI was associated with an absolute difference in four-year mortality of -27.8% (95% CI: -33.8% – -21.8%). 2d) Methods: The association between AAI and four-year mortality was examined using a linear regression model of the binary indicator of 4-year mortality regressed on AAI modeled as quadratic, including both untransformed and squared terms as continuous variables. The difference in 4-year mortality associated with a single-unit difference in log-AAI was provided by the regression coefficient for the log-AAI variable, calculated using robust standard errors in order to account for the heteroscedasticity of binary outcome variables. Statistical inference was based on the simultaneous test of the two regression coefficients for the untransformed and squared AAI terms using the global F-test. Results: Our results demonstrated a significant association between AAI modeled as quadratic and four-year-mortality (p < 0.001). 2e) Methods: The association between AAI and four-year mortality was examined using a linear regression model of the binary indicator of 4-year mortality regressed on AAI, which was categorized in the following 7 intervals: (0.25-0.55], (0.55-0.75], (0.75-0.95], (0.95-1.15], (1.151.35], (1.35-1.55], or (1.55-2.40], where a bracket indicates that that cut-point was included in the interval, vs. a parenthesis indicating not included. This categorical variable was modeled as a continuous term in the regression. The difference in 4-year mortality associated with a one level difference in AAI category was provided by the regression coefficient for the AAI variable, calculated using robust standard errors in order to account for the heteroscedasticity of binary outcome variables. Two-sided p-values and 95% confidence intervals were computed assuming the asymptotic normal distribution for the linear regression parameter estimates. Results: Our results demonstrated a significant association between AAI and four-year-mortality (p < 0.001); specifically, a one-level increase in AAI category was associated with an absolute difference in four-year mortality of -5.6% (95% CI: -7.1% – -4.0%). 2f) Methods: The association between AAI and four-year mortality was examined using a linear regression model of the binary indicator of 4-year mortality regressed on AAI, which was categorized into 7 intervals based on quantiles. This categorical variable was modeled as a continuous term in the regression. The difference in 4-year mortality associated with a one level difference in AAI category was provided by the regression coefficient for the AAI variable, calculated using robust standard errors in order to account for the heteroscedasticity of binary outcome variables. Two-sided p-values and 95% confidence intervals were computed assuming the asymptotic normal distribution for the linear regression parameter estimates. Results: Our results demonstrated a significant association between AAI and four-year-mortality (p < 0.001); specifically, a one-level increase in AAI quantile was associated with an absolute difference in four-year mortality of -2.1% (95% CI: -2.5% – -1.6%). 2g) Methods: The association between AAI and four-year mortality was examined using a linear regression model of the binary indicator of 4-year mortality regressed on AAI, which was modeled using linear splines with knots at 0.25, 0.55, 0.75, 0.95, 1.15, 1.35, 1.55, and 2.4; each was modeled as a continuous term in the regression. Statistical inference was based on a simultaneous test of the all regression coefficients using the global F-test. Results: Our results demonstrated a significant association between AAI modeled using linear splines and four-year-mortality (p < 0.001). 2h) The distinct slopes described in part 2a above are best modeled by the linear-spline model, followed next by the quadratic model. 3a) See 2a. 3b) Methods: The association between AAI and four-year mortality was examined using a logistic regression model of the binary indicator of 4-year mortality regressed on AAI modeled as a linear continuous variable. The odds of 4-year mortality associated with a single-unit difference in AAI was provided by the regression coefficient for the AAI variable. 95% confidence intervals for regression coefficients were computed using the asymptotic normal distribution for Wald-type maximum likelihood methods. A two-sided p value testing the null hypothesis of association between AAI and four-year mortality was based on the chi-squared statistic. Results: Our results demonstrated a significant association between AAI and four-year-mortality (p < 0.001); specifically, the odds ratio describing the association between a one unit decrease in AAI and death within four years was estimated to be 0.063 (95% CI: 0.039 – 0.10). 3c) Methods: The association between AAI and four-year mortality was examined using a logistic regression model of the binary indicator of 4-year mortality regressed on the natural logarithm of AAI modeled as a linear continuous variable. The odds ratio for the association of 4-year mortality with a single-unit difference in log-AAI was provided by the regression coefficient for the AAI variable. 95% confidence intervals for regression coefficients were computed using the asymptotic normal distribution for Wald-type maximum likelihood methods. A two-sided p value testing the null hypothesis of association between AAI and four-year mortality was based on the chi-squared statistic. Results: Our results demonstrated a significant association between AAI and four-year-mortality (p < 0.001); specifically, the odds ratio describing the association between a one unit decrease in log-AAI and death within four years was estimated to be 0.099 (95% CI: 0.067 – 0.15). 3d) Methods: The association between AAI and four-year mortality was examined using a logistic regression model of the binary indicator of 4-year mortality regressed on AAI modeled as quadratic, including both untransformed and squared terms as continuous variables. Statistical inference was based on a simultaneous test of the two regression coefficients for the untransformed and squared AAI terms using the global likelihood ratio test. Results: Our results demonstrated a significant association between AAI and four-year-mortality (p < 0.0001). 3e) Methods: The association between AAI and four-year mortality was examined using a logistic regression model of the binary indicator of 4-year mortality regressed on AAI, which was categorized in the following 7 intervals: (0.25-0.55], (0.55-0.75], (0.75-0.95], (0.95-1.15], (1.15-1.35], (1.35-1.55], or (1.55-2.40], where a bracket indicates that that cut-point was included in the interval, vs. a parenthesis indicating not included. This categorical variable was modeled as a continuous term in the regression. The odds ratio for the association of 4-year mortality with a one level difference in AAI category was provided by the regression coefficient for the AAI variable. 95% confidence intervals for regression coefficients were computed using the asymptotic normal distribution for Wald-type maximum likelihood methods. A two-sided p value testing the null hypothesis of association between AAI and four-year mortality was based on the chi-squared statistic. Results: Our results demonstrated a significant association between AAI and four-year-mortality (p < 0.001); specifically, The odds ratio for the association of 4-year mortality with a one level difference in AAI category was estimated to be 0.078 (95% CI: 0.050 – 0.12). 3f) Methods: The association between AAI and four-year mortality was examined using a logistic regression model of the binary indicator of 4-year mortality regressed on AAI, which was categorized into 7 intervals based on quantiles. This categorical variable was modeled as a continuous term in the regression. The odds ratio for the association of 4-year mortality with a one level difference in AAI category was provided by the regression coefficient for the AAI variable. 95% confidence intervals for regression coefficients were computed using the asymptotic normal distribution for Wald-type maximum likelihood methods. A two-sided p value testing the null hypothesis of association between AAI and four-year mortality was based on the chi-squared statistic. Results: Our results demonstrated a significant association between AAI and four-year-mortality (p < 0.001); specifically, The odds ratio for the association of 4-year mortality with a one level difference in AAI category was estimated to be 0.78 (95% CI: 0.75 – 0.82). 3g) Methods: The association between AAI and four-year mortality was examined using a logistic regression model of the binary indicator of 4-year mortality regressed on AAI, which was modeled using linear splines with knots at 0.25, 0.55, 0.75, 0.95, 1.15, 1.35, 1.55, and 2.4; each was modeled as a continuous term in the regression. The OR for the association of 4-year mortality with a one-level difference in AAI category was provided by the regression coefficient for the AAI variable. Statistical inference was based on the simultaneous test of all regression coefficients using the global likelihood ratio test. Results: Our results demonstrated a significant association between AAI modeled using linear splines and four-year-mortality (p < 0.001). 3h) The distinct slopes described in part 2a above appear to be best modeled by the linear-spline model. 4a) See 2a. 4b) Methods: The association between AAI and four-year mortality was examined using a Poisson regression model of the binary indicator of 4-year mortality regressed on AAI modeled as a linear continuous variable, calculated using robust variance estimates in order to account for the heteroscedasticity of binary outcome variables. The relative risk of death within four years associated with a single-unit difference in AAI was provided by the regression coefficient for the AAI variable. Two-sided p values and 95% CIs were computed assuming the asymptotic normal distribution for the Poisson regression-coefficient estimates. Results: Our results demonstrated a significant association between AAI and four-year-mortality (p < 0.001); specifically, the risk ratio for death within 4 years associated with a one-unit increase in AAI was estimated to be 0.097 (95% CI: 0.065 – 0.14). 4c) Methods: The association between AAI and four-year mortality was examined using a Poisson regression model with robust variance estimates in order to account for the heteroscedasticity of binary outcome variables. The binary indicator of 4-year mortality was regressed was regressed on the natural logarithm of AAI modeled as a linear continuous variable. The relative risk of death within four years associated with a single-unit difference in the natural logarithm of AAI was provided by the regression coefficient for the AAI variable. Two-sided p values and 95% CIs were computed assuming the asymptotic normal distribution for the Poisson regression-coefficient estimates. Our results demonstrated a significant association between AAI and four-year-mortality (p < 0.001); specifically, the risk ratio for death within 4 years associated with a one-unit increase in log-AAI was estimated to be 0.16 (95% CI: 0.12 – 0.21). 4d) Methods: The association between AAI and four-year mortality was examined using a Poisson regression model with robust variance estimates in order to account for the heteroscedasticity of binary outcome variables. The binary indicator of 4-year mortality was regressed was regressed on AAI modeled as quadratic, including both untransformed and squared terms as continuous variables. Statistical inference was based on a simultaneous test of the two regression coefficients for the untransformed and squared AAI terms using the global Wald test. Results: Our results demonstrated a significant association between AAI and four-year-mortality (p < 0.0001). 4e) Methods: The association between AAI and four-year mortality was examined using a Poisson regression model with robust variance estimates in order to account for the heteroscedasticity of binary outcome variables. The binary indicator of 4-year mortality was regressed was regressed on AAI, which was categorized in the following 7 intervals: (0.25-0.55], (0.55-0.75], (0.75-0.95], (0.95-1.15], (1.15-1.35], (1.35-1.55], or (1.55-2.40], where a bracket indicates that that cut-point was included in the interval, vs. a parenthesis indicating not included. This categorical variable was modeled as a continuous term in the regression. The risk ratio for the association of 4-year mortality with a one level difference in AAI category was provided by the regression coefficient for the AAI variable. Two-sided p values and 95% CIs were computed assuming the asymptotic normal distribution for the Poisson regressioncoefficient estimates. Results: Our results demonstrated a significant association between AAI and four-year-mortality (p < 0.001); specifically, The risk ratio for the association of 4-year mortality with a one level difference in AAI category was estimated to be 0.12 (95% CI: 0.083 – 0.17). 4f) Methods: The association between AAI and four-year mortality was examined using a Poisson regression model with robust variance estimates in order to account for the heteroscedasticity of binary outcome variables. The binary indicator of 4-year mortality was regressed was regressed on AAI, which was categorized in 7 intervals based on quantiles. This categorical variable was modeled as a continuous term in the regression. The risk ratio for the association of 4-year mortality with a one level difference in AAI category was provided by the regression coefficient for the AAI variable. Two-sided p values and 95% CIs were computed assuming the asymptotic normal distribution for the Poisson regression-coefficient estimates. Results: Our results demonstrated a significant association between AAI and four-year-mortality (p < 0.001); specifically, The risk ratio for the association of 4-year mortality with a one level difference in AAI category was estimated to be 0.80 (95% CI: 0.76 – 0.84). 4g) Methods: The association between AAI and four-year mortality was examined using a Poisson regression model with robust variance estimates in order to account for the heteroscedasticity of binary outcome variables. The binary indicator of 4-year mortality was regressed on AAI, which was modeled using linear splines with knots at 0.25, 0.55, 0.75, 0.95, 1.15, 1.35, 1.55, and 2.4; each was modeled as a continuous term in the regression. The RR for the association of 4-year mortality with a one-level difference in AAI category was provided by the regression coefficient for the AAI variable. Statistical inference was based on the simultaneous test of all regression coefficients using the global Wald test. Results: Our results demonstrated a significant association between AAI modeled using linear splines and four-year-mortality (p < 0.0001). 4h) The distinct slopes described in part 2a above appear to be best modeled by the linear-spline model. 5) The most striking differences in comparing the appearances of the graphs generated in 2h, 3h, and 4h are that in the logistic regression model, the probability values are bounded by 0 and 1, which is known to be an attractive feature of logistic regression; in the linear regression models, probability estimates go below zero, and in the Poisson models, some probability estimates are > 1. The general shapes of the models do not vary much based on the type of regression; in other words, the shape of the untransformed curve or linear spline curve is generally the same for RD, OR, and RR regression, just somewhat “squeezed” and/or shifted along the y-axis.
