Syllabus - Seton Hall University Pirate Server
advertisement
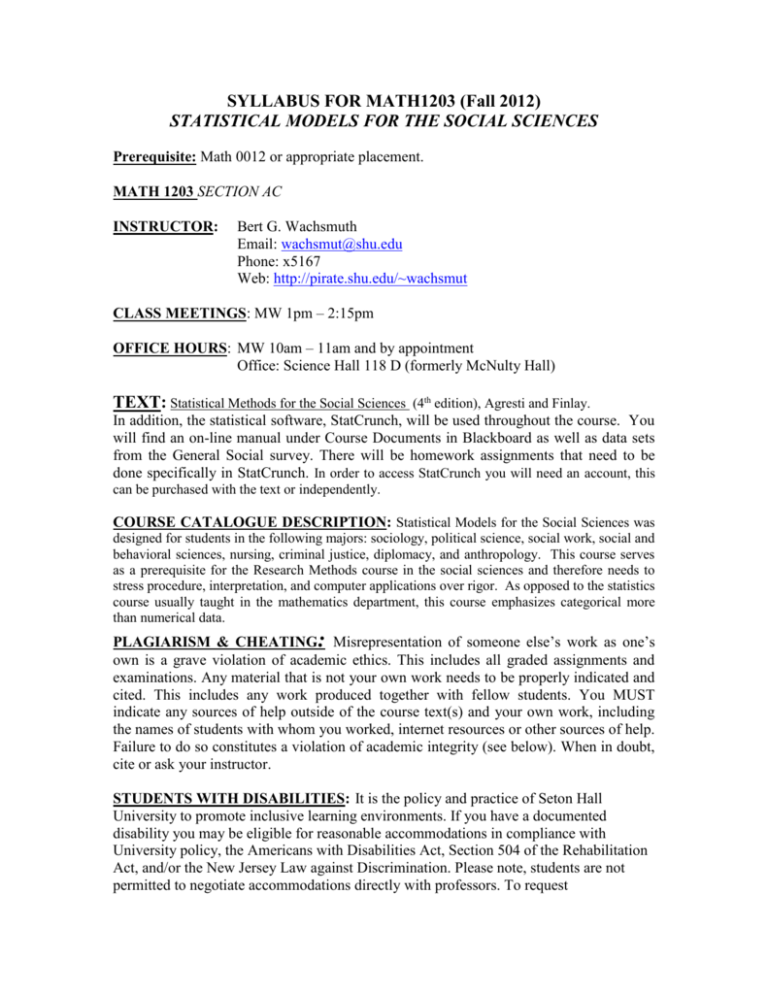
SYLLABUS FOR MATH1203 (Fall 2012) STATISTICAL MODELS FOR THE SOCIAL SCIENCES Prerequisite: Math 0012 or appropriate placement. MATH 1203 SECTION AC INSTRUCTOR: Bert G. Wachsmuth Email: wachsmut@shu.edu Phone: x5167 Web: http://pirate.shu.edu/~wachsmut CLASS MEETINGS: MW 1pm – 2:15pm OFFICE HOURS: MW 10am – 11am and by appointment Office: Science Hall 118 D (formerly McNulty Hall) TEXT: Statistical Methods for the Social Sciences (4th edition), Agresti and Finlay. In addition, the statistical software, StatCrunch, will be used throughout the course. You will find an on-line manual under Course Documents in Blackboard as well as data sets from the General Social survey. There will be homework assignments that need to be done specifically in StatCrunch. In order to access StatCrunch you will need an account, this can be purchased with the text or independently. COURSE CATALOGUE DESCRIPTION: Statistical Models for the Social Sciences was designed for students in the following majors: sociology, political science, social work, social and behavioral sciences, nursing, criminal justice, diplomacy, and anthropology. This course serves as a prerequisite for the Research Methods course in the social sciences and therefore needs to stress procedure, interpretation, and computer applications over rigor. As opposed to the statistics course usually taught in the mathematics department, this course emphasizes categorical more than numerical data. PLAGIARISM & CHEATING: Misrepresentation of someone else’s work as one’s own is a grave violation of academic ethics. This includes all graded assignments and examinations. Any material that is not your own work needs to be properly indicated and cited. This includes any work produced together with fellow students. You MUST indicate any sources of help outside of the course text(s) and your own work, including the names of students with whom you worked, internet resources or other sources of help. Failure to do so constitutes a violation of academic integrity (see below). When in doubt, cite or ask your instructor. STUDENTS WITH DISABILITIES: It is the policy and practice of Seton Hall University to promote inclusive learning environments. If you have a documented disability you may be eligible for reasonable accommodations in compliance with University policy, the Americans with Disabilities Act, Section 504 of the Rehabilitation Act, and/or the New Jersey Law against Discrimination. Please note, students are not permitted to negotiate accommodations directly with professors. To request accommodations or assistance, please self-identify with the Office for Disability Support Services (DSS), Duffy Hall, Room 67 at the beginning of the semester. For more information or to register for services, contact DSS at (973) 313-6003 or by e-mail at DSS@shu.edu. Link to Disability Policy - http://www.shu.edu/offices/disabilitysupport-services/faculty-syllabus-statement.cfm GRADE: The grade is determined by the following scores: Tests: 300 points Final exam: 100 points Quizzes: 100 points Computer: 100 points Please note that homework will be assigned daily but not collected. Instead we have regular short quizzes at least once per week, which will contain questions similar to homework questions. I will drop the worst two quiz scores automatically. There are no make-up exams or quizzes unless a student is seriously ill. OVERVIEW: Statistical Methods in the Social Sciences is designed to introduce students to the statistical techniques used in the social and behavioral sciences. The goal of the class is to create and interpret research studies in these fields. OBJECTIVES: 1. 2. 3. 4. To enhance and encourage the students’ critical thinking through the solution and analysis of statistics problems. Competency in the mathematical material in the course will be assessed through the tests and final examination as well as daily homework assignments. Competency in Numeracy will be achieved in this way: Numeracy: marked by meeting or exceeding expected standards of numerical calculation, graphical interpretation and estimation skills; the ability to deal comfortably with fundamental notions of number and chance; Students will be required to solve descriptive statistics problems; Students will be required to evaluate statistical output; Students will be required to write three articles in which data is generated and analyzed using StatCrunch. Competency in Information Technology will be enhanced by the use of StatCrunch and possibly Excel. OTHER NOTES: It is expected that all work submitted by students is their own. Any type of plagiarism or cheating could result in a reduction in grade or formal disciplinary actions depending on the severity and the specific policy of the instructor. COURSE MATERIAL: Chapter 1: Introduction Sections 1.1-1.4 Population, samples, data, descriptive and inferential statistics, Role of computers in statistics. Chapter 2: Sampling and Measurement. Sections 2.1-2.5 Categorical/numerical variables, nominal/ordinal variables, discrete/continuous variables, randomization, sampling methods. Chapter 3: Descriptive Statistics Sections 3.1-3.7 Frequency distributions, graphs, measures of central tendency, measures of variability, measures of position, bivariate descriptive statistics, sampling statistics and population parameters. Chapter 4: Probability Distributions. Sections 4.1, 4.3-4.7 Probability, normal distribution, sampling distribution, Central Limit Theorem. Chapter 5: Statistical Inference: Estimation. Sections 5.1-5.4, 5.6 Point and interval estimation, confidence intervals for mean and proportion, sample size. Chapter 6: Statistical Inference: Significance Tests. Sections 6.1-6.5, 6.8 Five parts of a significance test, significance tests for mean and proportion, decisions and types of errors in tests. Chapter 8: Analyzing Associations Between Categorical Variables Sections 8.1, 8.2, 8.4, 8.5, 8.7 Contingency tables, Chi-Squared test of independence, measuring association in contingency tables, finding gamma. Chapter 9: Linear Regression and Correlation Sections 9.1, 9.2, 9.4, 9.6, 9.7 Scatterplots, regression line, correlation coefficient r and r2. There may be additional topics at instructor’s discretion should time permit.
