Probability & Statistics Assignment Guide: Unit 6
Probability and Statistics – Mrs. Leahy
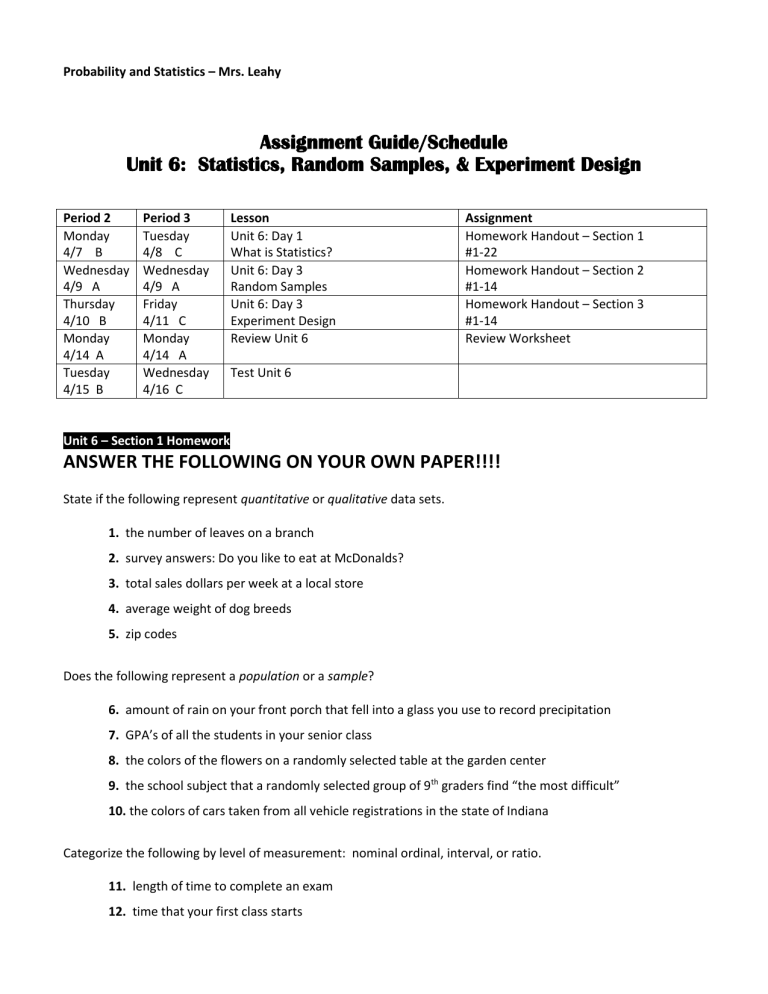
Assignment Guide/Schedule
Unit 6: Statistics, Random Samples, & Experiment Design
Period 2
Monday
4/7 B
Wednesday
4/9 A
Thursday
4/10 B
Monday
4/14 A
Tuesday
4/15 B
Period 3
Tuesday
4/8 C
Wednesday
4/9 A
Friday
4/11 C
Monday
4/14 A
Wednesday
4/16 C
Unit 6 – Section 1 Homework
Lesson
Unit 6: Day 1
What is Statistics?
Unit 6: Day 3
Random Samples
Unit 6: Day 3
Experiment Design
Review Unit 6
Test Unit 6
Assignment
Homework Handout – Section 1
#1-22
Homework Handout – Section 2
#1-14
Homework Handout – Section 3
#1-14
Review Worksheet
ANSWER THE FOLLOWING ON YOUR OWN PAPER!!!!
State if the following represent quantitative or qualitative data sets.
1. the number of leaves on a branch
2. survey answers: Do you like to eat at McDonalds?
3. total sales dollars per week at a local store
4. average weight of dog breeds
5. zip codes
Does the following represent a population or a sample?
6. amount of rain on your front porch that fell into a glass you use to record precipitation
7. GPA’s of all the students in your senior class
8. the colors of the flowers on a randomly selected table at the garden center
9. the school subject that a randomly selected group of 9 th graders find “the most difficult”
10. the colors of cars taken from all vehicle registrations in the state of Indiana
Categorize the following by level of measurement: nominal ordinal, interval, or ratio.
11. length of time to complete an exam
12. time that your first class starts
(continued) Categorize the following by level of measurement: nominal ordinal, interval, or ratio.
13. your declared college major
14. course evaluation scale: poor, acceptable, good
15. score on the last exam (based on 100 possible points)
16. age of student
17. salesperson’s performance: below average, average, above average
18. price of company’s stock
19. names of new products offered by a company
20. temperature (in °F) in CEO’s private office
21. income of the CEO for the past 5 years
22. color of product packaging
Unit 6 – Section 2 Homework
ANSWER THE FOLLOWING ON
YOUR OWN PAPER!!!!
1. Use the random number table to generate a list of 10 random numbers between 1 and 99.
(Start with column 2, row 5)
2. Use the random number table to generate a list of 10 random numbers between 1 and 250.
(Start with column 4, row 1)
#3-7 Modern Managed Hospitals (MMH) is a national for-profit chain of hospitals. Management wants to survey patients discharged this past year to obtain patient satisfaction profiles. They wish to use a sample of such patients. Several sampling techniques are described below. Categorize each technique as Simple Random
Sample, Stratified Sample, Systematic Sample, Cluster Sample, or Convenience Sample.
3. Obtain a list of patients discharged from MMH facilities. Divide patients according to lengths of hospitals stays (2 days or less, 3-7 days, 8-14 days, more than 14 days). Draw a simple random sample from each group.
4. Obtain lists of patients discharged from all MMH facilities. Number these patients, and then use a random-number table to obtain the sample.
5. Randomly select some MMH facilities from each of five geographic regions, then include all the patients on the discharge lists of the selected hospitals.
(continued) Categorize each technique as Simple Random Sample, Stratified Sample, Systematic Sample, Cluster
Sample, or Convenience Sample.
6. At the beginning of the year, instruct each MMH facility to survey every 500 discharged. th patient being
7. Instruct each MMH facility to survey 10 discharged patients this week and send in the results.
An important part of employee compensation is a benefits package, which might include health insurance, life insurance, child care, vacation days, retirement plan, parental leave, bonuses, etc. Suppose you want to conduct a survey of benefits packages available in private businesses in Hawaii. You want a sample size of 100. Categorize each technique below as Simple Random Sample, Stratified Sample, Systematic Sample, Cluster Sample, or
Convenience Sample.
8. Assign each business in the Island Business Directory a number, and then use a random number table to select the businesses to be included in the sample.
9. Use postal ZIP Codes to divide the state into regions. Pick a random sample of 10 ZIP Codes areas and then include all the businesses in each selected ZIP Code area.
10. Send a team of five research assistants to Bishop Street in downtown Honolulu. Let each assistant select a block or building and interview an employee from each business found. Each researcher can have the rest of the day off after getting responses from 20 different businesses.
11. Use the Island Business Directory. Number all the businesses. Select a starting place at random, and then use every 50 th business listed until you have 100 businesses.
12. Group the businesses according to type: medical, shipping, retail, manufacturing, financial, construction, restaurant, hotel, tourism, other. Then select a random sample of 10 businesses from each business type.
In each of the following situations, the sampling frame does not match the population, resulting in undercoverage. Give examples of population members that might have been omitted. (Hint: Ask yourself “Who doesn’t get a chance to be part of the sample?)
13. The population consists of all 250 students in your large statistics lecture class. You plan to obtain a simple random sample of 20 students by using the sample frame of students present next Monday.
14. The population consists of all 15-year-olds living in the attendance district of a local high school. You plan to obtain a simple random sample of 200 15-year-olds by using the student roster of the high school as the sampling frame.
Probability and Statistics – Mrs. Leahy
Unit 6 – Section 3 Homework
