Statistics Review 10A Name: Part I. Multiple choice. Circle the letter
advertisement

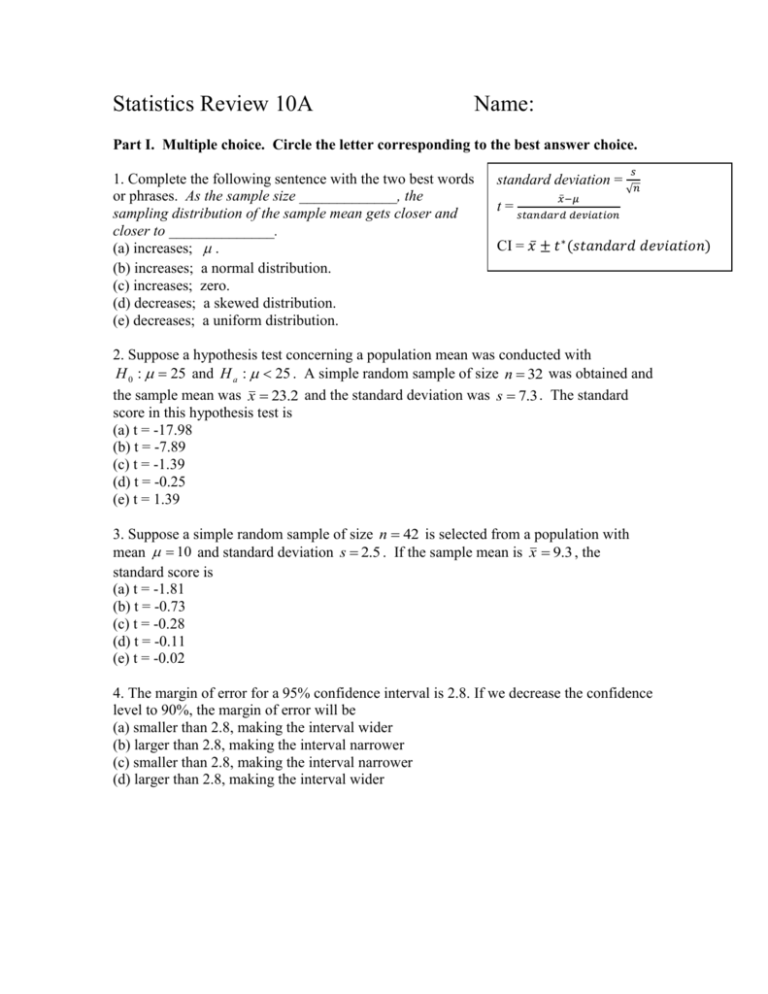
Statistics Review 10A Name: Part I. Multiple choice. Circle the letter corresponding to the best answer choice. 1. Complete the following sentence with the two best words or phrases. As the sample size _____________, the sampling distribution of the sample mean gets closer and closer to ______________. (a) increases; . (b) increases; a normal distribution. (c) increases; zero. (d) decreases; a skewed distribution. (e) decreases; a uniform distribution. standard deviation = 𝑥̅ −𝜇 𝑠 √𝑛 t = 𝑠𝑡𝑎𝑛𝑑𝑎𝑟𝑑 𝑑𝑒𝑣𝑖𝑎𝑡𝑖𝑜𝑛 CI = 𝑥̅ ± 𝑡 ∗ (𝑠𝑡𝑎𝑛𝑑𝑎𝑟𝑑 𝑑𝑒𝑣𝑖𝑎𝑡𝑖𝑜𝑛) 2. Suppose a hypothesis test concerning a population mean was conducted with H 0 : 25 and H a : 25 . A simple random sample of size n 32 was obtained and the sample mean was x 23.2 and the standard deviation was s 7.3 . The standard score in this hypothesis test is (a) t = -17.98 (b) t = -7.89 (c) t = -1.39 (d) t = -0.25 (e) t = 1.39 3. Suppose a simple random sample of size n 42 is selected from a population with mean 10 and standard deviation s 2.5 . If the sample mean is x 9.3 , the standard score is (a) t = -1.81 (b) t = -0.73 (c) t = -0.28 (d) t = -0.11 (e) t = -0.02 4. The margin of error for a 95% confidence interval is 2.8. If we decrease the confidence level to 90%, the margin of error will be (a) smaller than 2.8, making the interval wider (b) larger than 2.8, making the interval narrower (c) smaller than 2.8, making the interval narrower (d) larger than 2.8, making the interval wider 5. In a test of H0: = 4 against Ha: 4, a sample of size 100 produces x 4.5 and s = 2.5. Thus the P-value (or observed level of significance) of the test is approximately equal to: (a) 0.841 (b) 0.421 (c) 0.100 (d) 0.048 (e) 0.024 6. In a large population of adults, the mean IQ is 112 with a standard deviation of 20. Suppose 200 adults are randomly selected for a market research campaign. The distribution of the sample mean IQ is (a) Exactly normal, mean 112, standard deviation 20. (b) Approximately normal, mean 112, standard deviation 0.1. (c) Approximately normal, mean 112, standard deviation 1.414. (d) Approximately normal, mean 112, standard deviation 20. 7. The value of t* required for a 70% confidence interval with df = 14 is (a) -0.5244 (b) 1.076 (c) 0.15 (d) 0.30 8. You want to compute a 90% confidence interval for the mean of a population with unknown population standard deviation. The sample size is 30. The value of t* you would use for this interval is (a) 1.96 (b) 1.645 (c) 1.699 (d) .90 (e) 1.311 (f) None of the above 9. Suppose a hypothesis test is conducted concerning a population mean with H 0 : 4.21 and H a : 4.21 . What does a P-value of 0.001 mean? (a) There is no evidence to suggest the population mean is different from 4.21. (b) There is strong evidence to suggest the population mean is different from 4.21. (c) There is strong evidence to suggest the population mean is greater than 4.21. (d) There is strong evidence to suggest the population mean is less than 4.21. (e) There is strong evidence to suggest the individual population is not normal. 10. A simple random sample of size n 30 is obtained with a mean of 65 and a standard deviation of 6. The 95% confidence interval for µ is: (a) (53.0, 77.0) (b) (62.8, 67.2) (c) (61.7, 68.3) (d) (59.3, 70.7) (e) cannot be determined 11. An NCAA official claims that the average 10K time for students trying out for college cross-country teams is 33 minutes. A Big 12 coach believes the true figure is lower among Big 12 universities. He picks a simple random sample of 40 recruits and calculates their mean 10K time is 32 minutes and 40 seconds, with a standard deviation of 42 seconds. What is the appropriate test statistic and p-value? [HINT: 60 seconds = 1 minute] a) z = -3.01, p = .0013 b) t = -3.01, p = .0045 c) z = -1.43, p = .0764 d) t = -3.01, p = .0022 e) There is insufficient information given to draw a conclusion. 12. As the sample size increases, the standard deviation of the sampling distribution: a) does not change b) gets smaller c) gets larger d) varies independently of the sample size 13. As the sample size increases, the margin of error of the confidence interval: a) does not change b) gets smaller c) gets larger d) varies independently of the sample size 14. In a study of 120 American adults, the average number of Facebook friends they had was 338 with a standard deviation of 102. What is the margin of error for a 90% confidence interval for the average number of Facebook friends for American adults? a) 169.32 b) 15.46 c) 19.72 d) 11.88 Part II: Short Answer. 12. The manager of a pet supply store believes the reason many freshwater fish die in home aquariums is because the pH level is greater than the acceptable level of 7.5. A simple random sample of 48 home aquariums was obtained and the pH of each was carefully measured. The sample mean was x 7.6 and the sample standard deviation was s 0.35 . Use this information to determine if the mean pH of home aquariums is greater than 7.5. (a) State the null and the alternative hypothesis. (b) Describe the sampling distribution. (c) Find the test statistic and P-value. (d) State your conclusion using an α = 0.05. 13. The level of dissolved oxygen in a river is an important indicator of the water’s ability to support aquatic life. You collect water samples at 15 randomly chosen locations along a stream and measure the dissolved oxygen. Here are your results in milligrams per liter: 4.53, 5.04, 3.29, 5.23, 4.13, 5.50, 4.83, 4.40, 5.42, 6.38, 4.01, 4.66, 2.87, 5.73, 5.55 (a) Construct and interpret a 95% confidence interval for the mean dissolved oxygen level for this stream. (b) Does the interval support or reject a claim that the average amount of dissolved oxygen for this stream is 4.0 mg/L? (c) Conduct a test of significance to see if the data provides evidence that the stream does not have an oxygen level of 4.0 mg/L. Hypotheses: Sampling Distribution: Test Statistic and p-value: Conclusion: (d) Does the interval and test reach the same conclusion?


