Practice Midterm Questions
advertisement
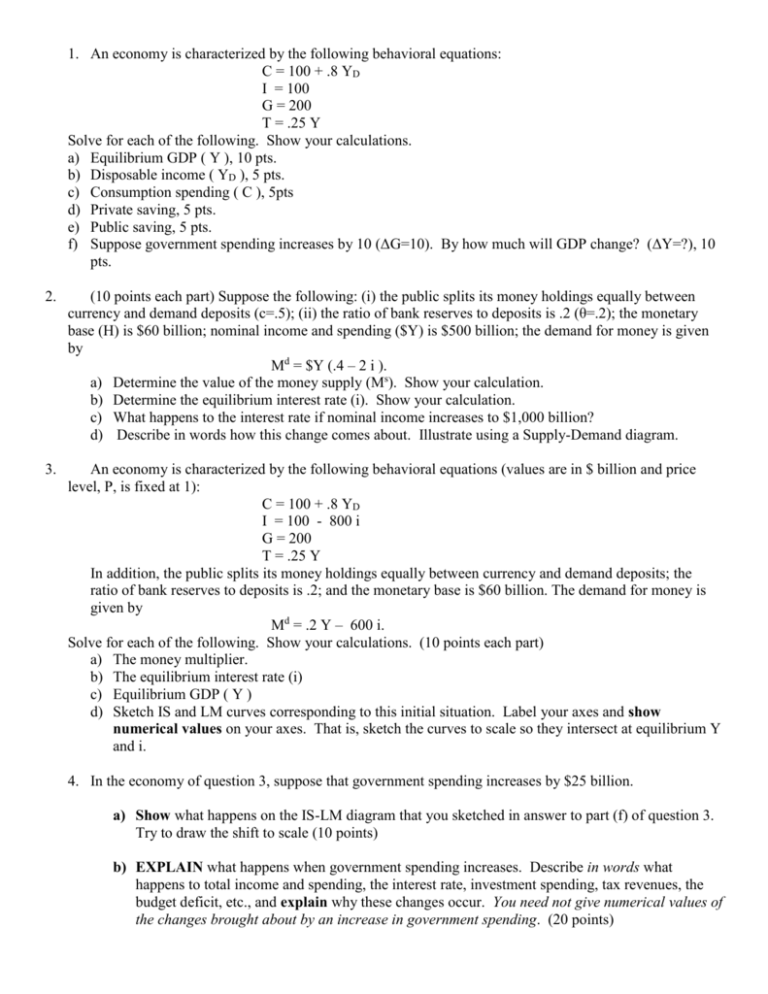
1. An economy is characterized by the following behavioral equations: C = 100 + .8 YD I = 100 G = 200 T = .25 Y Solve for each of the following. Show your calculations. a) Equilibrium GDP ( Y ), 10 pts. b) Disposable income ( YD ), 5 pts. c) Consumption spending ( C ), 5pts d) Private saving, 5 pts. e) Public saving, 5 pts. f) Suppose government spending increases by 10 (ΔG=10). By how much will GDP change? (ΔY=?), 10 pts. 2. (10 points each part) Suppose the following: (i) the public splits its money holdings equally between currency and demand deposits (c=.5); (ii) the ratio of bank reserves to deposits is .2 (θ=.2); the monetary base (H) is $60 billion; nominal income and spending ($Y) is $500 billion; the demand for money is given by Md = $Y (.4 – 2 i ). a) Determine the value of the money supply (Ms). Show your calculation. b) Determine the equilibrium interest rate (i). Show your calculation. c) What happens to the interest rate if nominal income increases to $1,000 billion? d) Describe in words how this change comes about. Illustrate using a Supply-Demand diagram. 3. An economy is characterized by the following behavioral equations (values are in $ billion and price level, P, is fixed at 1): C = 100 + .8 YD I = 100 - 800 i G = 200 T = .25 Y In addition, the public splits its money holdings equally between currency and demand deposits; the ratio of bank reserves to deposits is .2; and the monetary base is $60 billion. The demand for money is given by Md = .2 Y – 600 i. Solve for each of the following. Show your calculations. (10 points each part) a) The money multiplier. b) The equilibrium interest rate (i) c) Equilibrium GDP ( Y ) d) Sketch IS and LM curves corresponding to this initial situation. Label your axes and show numerical values on your axes. That is, sketch the curves to scale so they intersect at equilibrium Y and i. 4. In the economy of question 3, suppose that government spending increases by $25 billion. a) Show what happens on the IS-LM diagram that you sketched in answer to part (f) of question 3. Try to draw the shift to scale (10 points) b) EXPLAIN what happens when government spending increases. Describe in words what happens to total income and spending, the interest rate, investment spending, tax revenues, the budget deficit, etc., and explain why these changes occur. You need not give numerical values of the changes brought about by an increase in government spending. (20 points) III. Explain the economic intuition behind the familiar relations on the facing page. (10 points each part). a) b) c) d) e) f) g) h) i) j) Why does the real wage increase with output along the wage-setting relation? Why is the real wage constant along the price-setting relation? Why does price rise with output along the short-run aggregate supply curve? Why does output fall when price rises along the aggregate demand curve? Why does the interest rate rise with output along the LM curve? Why does output increase when the interest rate falls along the IS curve? Why is Y0 the “natural” rate of output? What can cause the aggregate demand curve to shift? What can cause short-run aggregate supply to shift? What can change the “natural” rate of output and cause medium-run aggregate supply to shift? II. Suppose that energy costs fall because of US success in Iraq. Trace the short-run and medium-run impacts of lower energy costs on the US economy. Show all shifts through time on the graphs below and comment on what is happening at each step. You can get fresh graphs if you need them. Be sure to put your name on any additional graph sheets you use. (50 points) W/P Real Wage WSo (W/P)o PSo Y Output P Price ASo Po ADo Y Output i Interest Rate LMo io ISo Y Yo Output


