Annual ACS Data
advertisement
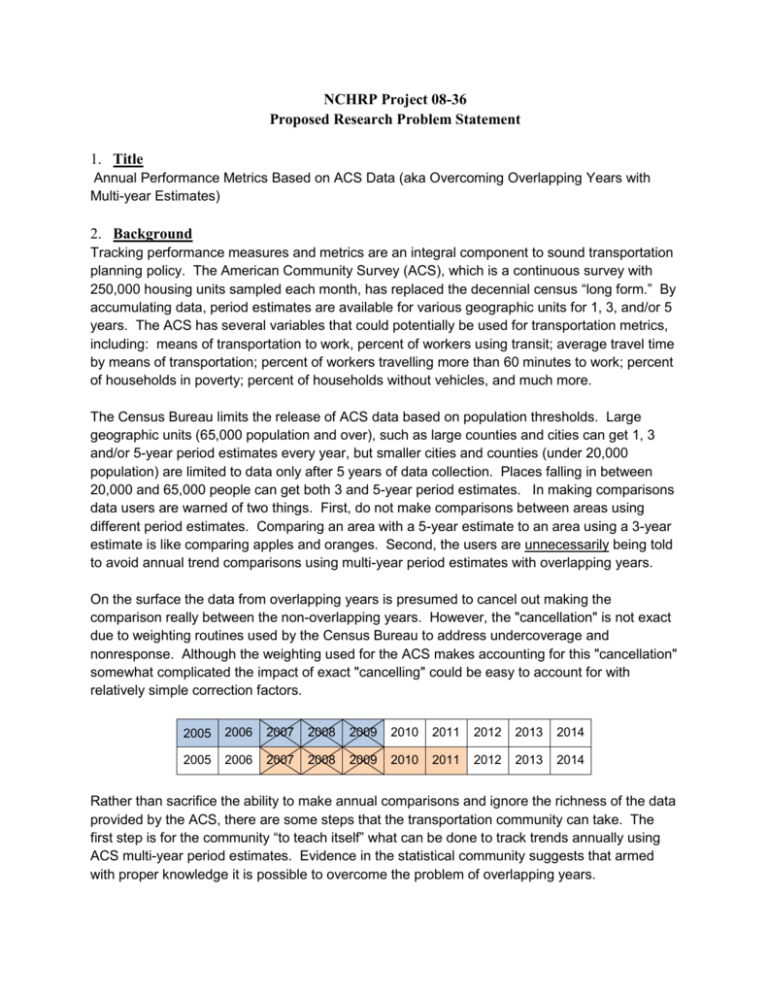
NCHRP Project 08-36 Proposed Research Problem Statement 1. Title Annual Performance Metrics Based on ACS Data (aka Overcoming Overlapping Years with Multi-year Estimates) 2. Background Tracking performance measures and metrics are an integral component to sound transportation planning policy. The American Community Survey (ACS), which is a continuous survey with 250,000 housing units sampled each month, has replaced the decennial census “long form.” By accumulating data, period estimates are available for various geographic units for 1, 3, and/or 5 years. The ACS has several variables that could potentially be used for transportation metrics, including: means of transportation to work, percent of workers using transit; average travel time by means of transportation; percent of workers travelling more than 60 minutes to work; percent of households in poverty; percent of households without vehicles, and much more. The Census Bureau limits the release of ACS data based on population thresholds. Large geographic units (65,000 population and over), such as large counties and cities can get 1, 3 and/or 5-year period estimates every year, but smaller cities and counties (under 20,000 population) are limited to data only after 5 years of data collection. Places falling in between 20,000 and 65,000 people can get both 3 and 5-year period estimates. In making comparisons data users are warned of two things. First, do not make comparisons between areas using different period estimates. Comparing an area with a 5-year estimate to an area using a 3-year estimate is like comparing apples and oranges. Second, the users are unnecessarily being told to avoid annual trend comparisons using multi-year period estimates with overlapping years. On the surface the data from overlapping years is presumed to cancel out making the comparison really between the non-overlapping years. However, the "cancellation" is not exact due to weighting routines used by the Census Bureau to address undercoverage and nonresponse. Although the weighting used for the ACS makes accounting for this "cancellation" somewhat complicated the impact of exact "cancelling" could be easy to account for with relatively simple correction factors. 2005 2006 2007 2008 2009 2010 2011 2012 2013 2014 2005 2006 2007 2008 2009 2010 2011 2012 2013 2014 Rather than sacrifice the ability to make annual comparisons and ignore the richness of the data provided by the ACS, there are some steps that the transportation community can take. The first step is for the community “to teach itself” what can be done to track trends annually using ACS multi-year period estimates. Evidence in the statistical community suggests that armed with proper knowledge it is possible to overcome the problem of overlapping years. 3. Statement of Urgency The first ACS 5-year estimates were released in December 2010. A new set of estimates is due to be released in late 2011 with subsequent data released every year. As a result, states, MPOs and transit agencies are just now beginning to contemplate its use. To fully exploit the information contained in the ACS, research needs to be undertaken “now” to address the overlapping years problem. 4. Project Objective(s) There are two overarching objectives: A. To demonstrate the richness of this data to the transportation community while helping to educate the planning practitioner on the proper use of annual ACS estimates. B. To equip the data users with the proper knowledge and tools to overcome the problem of comparing ACS data with overlapping years. 5. Relationship to Existing Body of Knowledge There is a great deal of history and technical information surrounding the use of Census data for transportation planning. Institutionally, the AASHTO Census Transportation Planning Products Oversight Board is heavily invested in developing data resources from ACS data, a new Commuting in America report is being proposed and a great deal of training resources are being dedicated to working with ACS data. Unfortunately, there is little to no information available for the transportation planner on how to deal with “the overlapping years” issue. In fact, the “Compass” report series which is the guidance document produced by the Census Bureau for the general data user suggests “that changes over time are best evaluated with multi-year estimates that do not overlap”. 6. List of Anticipated Work Tasks Develop guidance for the transportation community (MPOs, State DOTS and transit agencies) on the use of ACS multi-year period estimates to track and report on annual trends. Report on what can be done with the data and how to do it. Provide a detailed discussion of what measures can be trended and which, if any, can not. Develop methodological templates that can be used when developing metrics than can be used by the transportation data analyst. Templates should contain methods for calculating and/or recalculating margins of errors within and across years and metrics. Finally, results and guidance material should be presented in a way that can be easily understood and used by the community. 7. Estimate of Funds Needed $75,000 8. Estimate of Time Needed to Complete the Research 12-months 9. Name, Affiliation and Contact Information of Submitter(s) Ed Christopher Resource Center FHWA 4749 Lincoln Mall Drive Matteson, IL 60443 708-283-3534 (v) edc@berwyned.com Michael Cohen Committee on National Statistics The National Academies 500 Fifth Street, NW, 11th Floor Washington, DC 20001, USA (202) 334-2240 mcohen@nas.edu 10. Date of Submittal March 31, 2011 This proposal has been vetted through the AASHTO Census Transportation Planning Products Oversight Board and has the support of the TRB Committee on Urban Data and Information Systems (ABJ30).
