US Census Bureau: Three Demographic Programs
advertisement
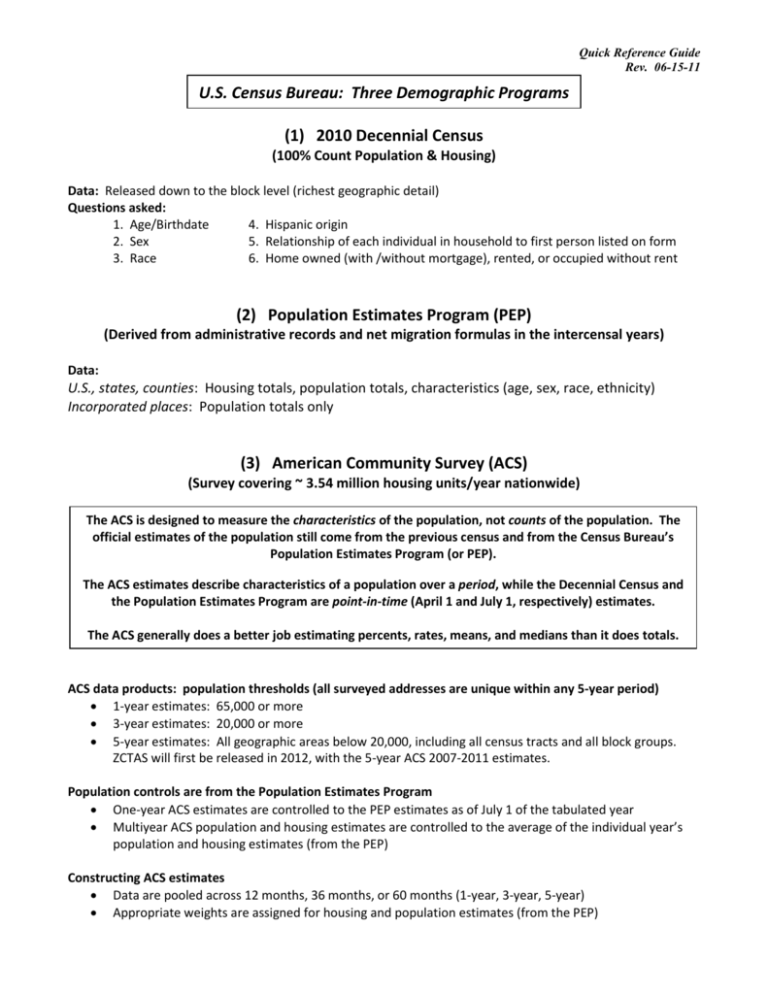
Quick Reference Guide Rev. 06-15-11 U.S. Census Bureau: Three Demographic Programs (1) 2010 Decennial Census (100% Count Population & Housing) Data: Released down to the block level (richest geographic detail) Questions asked: 1. Age/Birthdate 4. Hispanic origin 2. Sex 5. Relationship of each individual in household to first person listed on form 3. Race 6. Home owned (with /without mortgage), rented, or occupied without rent (2) Population Estimates Program (PEP) (Derived from administrative records and net migration formulas in the intercensal years) Data: U.S., states, counties: Housing totals, population totals, characteristics (age, sex, race, ethnicity) Incorporated places: Population totals only (3) American Community Survey (ACS) (Survey covering ~ 3.54 million housing units/year nationwide) The ACS is designed to measure the characteristics of the population, not counts of the population. The official estimates of the population still come from the previous census and from the Census Bureau’s Population Estimates Program (or PEP). The ACS estimates describe characteristics of a population over a period, while the Decennial Census and the Population Estimates Program are point-in-time (April 1 and July 1, respectively) estimates. The ACS generally does a better job estimating percents, rates, means, and medians than it does totals. ACS data products: population thresholds (all surveyed addresses are unique within any 5-year period) 1-year estimates: 65,000 or more 3-year estimates: 20,000 or more 5-year estimates: All geographic areas below 20,000, including all census tracts and all block groups. ZCTAS will first be released in 2012, with the 5-year ACS 2007-2011 estimates. Population controls are from the Population Estimates Program One-year ACS estimates are controlled to the PEP estimates as of July 1 of the tabulated year Multiyear ACS population and housing estimates are controlled to the average of the individual year’s population and housing estimates (from the PEP) Constructing ACS estimates Data are pooled across 12 months, 36 months, or 60 months (1-year, 3-year, 5-year) Appropriate weights are assigned for housing and population estimates (from the PEP) Quick Reference Guide Rev. 06-15-11 Comparing ACS estimates with Census data Comparisons can be made for most population and housing subjects Global differences (residence rules, universes, and reference periods) exist between the ACS and the Decennial Census, and some items cannot be compared at all For more information, see http://www.census.gov/acs/www/guidance_for_data_users/comparing_2009/ Comparing two or more ACS estimates across different geographic areas Use the same length time period (1-year ACS estimate to other 1-year ACS estimate, and so on) Use the same time period when making comparisons (2007-2009 to 2007-2009, for instance) Comparing two or more ACS estimates for one geographic area across time Use the same length time period Try to compare non-overlapping periods; statistical testing is more straightforward (See Compass Guide) Use caution if geographic boundaries have changed over time Dollar-valued (or dollar-denominated) estimates in multiyear estimates Income Rent Home values Energy costs Estimates are adjusted for inflation to the most recent year, using inflation factors based on the Consumer Price Index (or CPI). A similar adjustment is also done for individual months within a one-year estimate. Inflation adjustment is designed to put the collected data into dollars of equal value. Geographic boundaries in multiyear estimates Based on geographic boundaries as of January 1 of the last year in the multi-year period. Census Bureau’s annual Boundary Annexation Survey (or BAS) collects information about the following legally defined geographic areas: o Counties or county-equivalents o Incorporated places o Federally-recognized American Indian areas Boundaries of other statistical areas (such as census tracts, block groups, urbanized areas, PUMAs) are updated every decade in conjunction with the decennial census ACS 5-year estimates For most areas, no population thresholds; there are some disclosure-related release restrictions, most of which apply only to block groups Will not be filtered based on the reliability of the estimates; many published estimates will be unreliable - - decision to release these data driven by the need to provide building blocks for users and to be certain even the smallest areas receive data Data user must look at the margins of error (MOEs)! Will be released every year, dropping the oldest year and adding the most recent Excluded data products: Comparison profiles, state ranking profiles, selected population profiles Planned for production using 2006-2010 estimates: Summary File 4 and AIAN Summary File Census block group estimates: o Not displayed as tables in American FactFinder (AFF) for the casual data user o Released only in summary file format, accessible from the AFF download center


