Seasonal Variations
advertisement
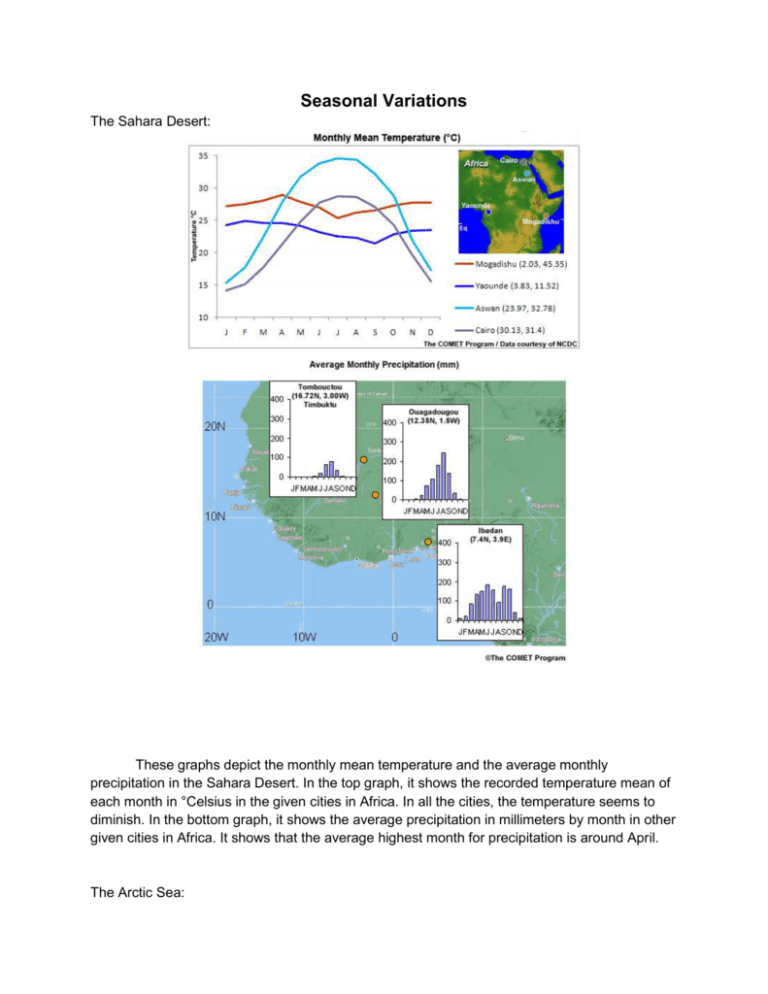
Seasonal Variations The Sahara Desert: These graphs depict the monthly mean temperature and the average monthly precipitation in the Sahara Desert. In the top graph, it shows the recorded temperature mean of each month in °Celsius in the given cities in Africa. In all the cities, the temperature seems to diminish. In the bottom graph, it shows the average precipitation in millimeters by month in other given cities in Africa. It shows that the average highest month for precipitation is around April. The Arctic Sea: In these two graphs, it shows the average sea surface temperature and the ice extent of the Arctic sea. In both graphs, the y-axis is labeled by years. In the top graph, you are shown the average global sea surface temperature in the Arctic Sea and in the bottom graph, you are shown the monthly average Arctic Sea ice extent from 1979-2012.
