Principles of Digital X-ray Imaging
TEP
5.5.01
-01
Related topics
exposure time, detector saturation, full well capacity, detector calibration, beam intensity, detector offset,
pixel specific gain, attenuation and transmission, image processing.
Principle
With digital X-ray imaging, X-ray photons that interact with the detector are converted to a digital signal.
This permits to record digital radiographies. With this experiment, the principles of digital detectors for Xray imaging are laid out.
Equipment
1
1
1
XRE 4.0 X-ray expert set
XRCT 4.0 X-ray Computed Tomography upgrade set
XR 4.0 Accessories for CT
09110-88
09180-88
09057-44
Additional equipment
PC, Windows® 7 or higher
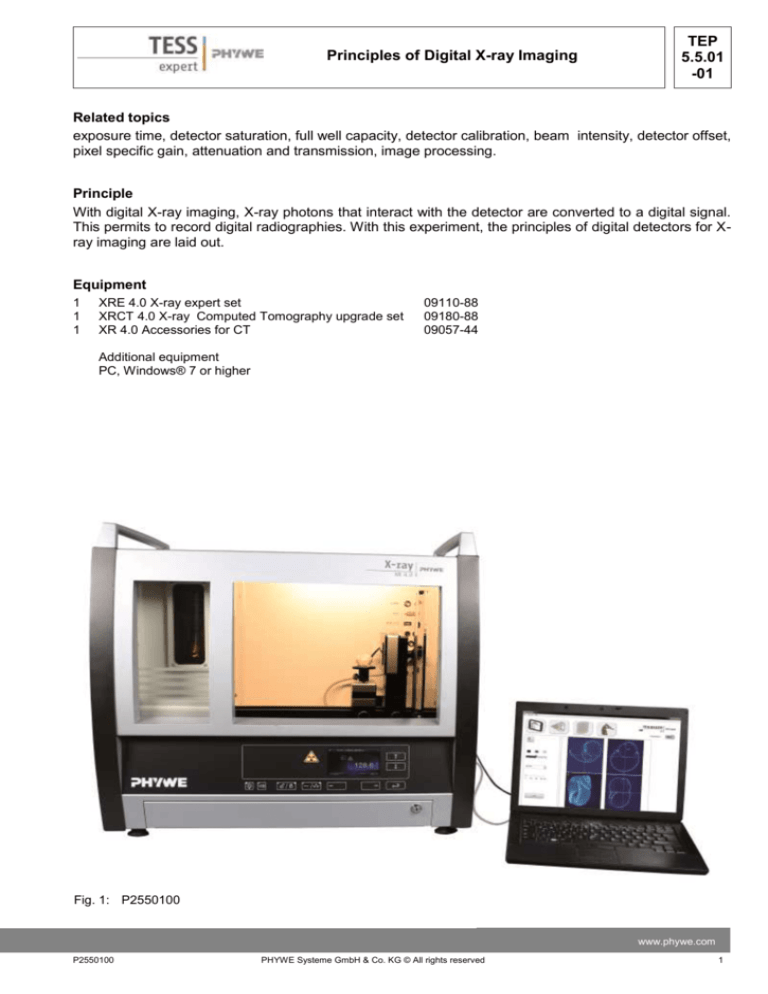
Fig. 1: P2550100
www.phywe.com
P2550100
PHYWE Systeme GmbH & Co. KG © All rights reserved
1
TEP
5.5.01
-01
Principles of Digital X-ray Imaging
Tasks
1. Define a good exposure time.
2. Calibrate the detector
3. Take some radiographies of an object and process the images with the image viewer
Set-up
Attach the XRIS to its stage.
Place the Digital X-ray detector XRIS on the rail at position 25 cm. The back side of the XRIS stage corresponds to its position on the rail. This position is called the 'source to detector distance' SDD (mm).
Fig. 2: Set-up of the XRIS
2
PHYWE Systeme GmbH & Co. KG © All rights reserved
P2550100
TEP
5.5.01
-01
Principles of Digital X-ray Imaging
Note
Details concerning the operation of the X-ray unit
and Detector as well as information on how to handle the detector can be found in the respective operating instructions.
Procedure
- Connect the X-ray unit via USB cable to the
USB port of your computer (the correct port of
the X-ray unit is marked in Fig. 3).
- Connect the usb cable of the detector to the
computer
-
-
-
-
-
-
Fig. 3: Connection of the computer
Start the “measureCT” program. A virtual X-ray
unit , rotation stage and Detector will be displayed on the screen. The green indication LED
on the left of each components indicates that its
presence has been detected (Fig. 4)
You can change the High Voltage and current
of the X-ray tube in the corresponding input
windows or manually on the unit. (Fig.4)
When clicking on the unit pictogram additional
information concerning the unit can be retrieved( Fig.4)
The status pictogram indicate the status of the
unit and can also be used to control the unit
such as switching on and off the light or the Xrays (Fig4.)
The position of the digital detector can be adjusted to its real position either by moving the
XRIS pictogram or by filling in the correct value
in the input window. (Fig.4)
The settings of the XRIS can be adjusted using
the input windows. The exposure time controls
the time between two frames are retrieved from
the detector, the number of frames defines how
many frames are averaged and with the binning
mode the charge of neighbouring pixels is averaged to reduce the total amount of pixels in one
frame.
Fig. 4: Part of the user interface of the software
www.phywe.com
P2550100
PHYWE Systeme GmbH & Co. KG © All rights reserved
3
TEP
5.5.01
-01
Principles of Digital X-ray Imaging
Experiment execution
1. Exposure time and saturation
-
Adjust the XRIS settings and X-ray unit settings according to fig.5 or load the configuration from the
predefined CTO file 'Experiment 1' (see Fig. 5).
Overview of the settings of the XRIS and Xray unit:
- 35kV, 1.00mA
- exposure time 0.5 sec
- Number of frames: 1
- Binning mode 500x500
- SDD= 250
Fig. 5: The settings for this experiment (left panel) and the method load and adjust the settings (right panel)
-
Start a new experiment, give it a unique name and fill in your details (fig.6). Alternatively it is also
possible to load this experiment with pre-recorded images and open this manual. The correct configuration will be loaded automatically as well but the functionalities of the software will be limited to
avoid overwriting the existing data.
Fig. 6: How to create a new or open an existing experiment
4
PHYWE Systeme GmbH & Co. KG © All rights reserved
P2550100
Principles of Digital X-ray Imaging
-
TEP
5.5.01
-01
Switch on the X-rays and activate the 'Live view' (see fig.7). When the Live view is activated, every
new image that is retrieved from the X-ray detector is displayed. The Detector exposure load bar
(see fig.7) indicates the average degree of fill for each pixel. It is very important to remain below
the maximal fill degree of the detector. Otherwise the detector will be saturated and won't work
properly. If the saturation level is reached, the load bar will turn red. (see theory for more explanation).
Fig. 7: Activation of the Live View and the detector exposure fill degree
Increase and decrease the exposure time of the detector between 0.23 sec and 2 sec
while watching the load bar. Note: after the adjustment of the exposure time, leave sufficient time for the detector to physically adjust itself to the new settings.
The fill degree of the detector is linearly dependant on the exposure time but is also influenced by the intensity of the beam. This beam intensity can be modified in three ways:
1. Change of maximal kV
2. Change of current
3. Variation in SDD
-
-
Change the maximal kV between 10 and 35 kV for a given current and exposure time while watching the Load bar.
Change the current between 0.1 and 1.00 mA for a given kV and exposure time while watching the
Load bar
-
The increase in fill degree is not linearly proportional to the adjustment of the kV range, see experiment 3 for more explanation.
-
-
The fill degree of the detector is also influenced by the distance of the detector to the source. The fill
degree is proportional to the intensity of the beam that falls on the detector which itself is proportional to its opening angle. The intensity is governed by the inverse square law (see experiment 3).
Vary the SDD by manually placing the detector closer or further from the source and watch the load
bar:
Open the Unit
www.phywe.com
P2550100
PHYWE Systeme GmbH & Co. KG © All rights reserved
5
TEP
5.5.01
-01
Principles of Digital X-ray Imaging
Change the SDD
Switch on the X-rays and wait 10 sec
Look at the load bar
Note: For all the further experiments it is important to remain under the saturation level,
watch the load bar closely after each modification of one of these three parameters.
2. Detector calibration
After having defined the desired and adequate configuration for the experiment (fig.5), the detector
needs to be calibrated. Each digital detector has a different and variable offset and pixel-specific gain
(see theory). During the calibration these variations will be measured and stored. Such corrections are
performed automatically by the software:
Automatic correction:
- Make sure there is no object between the source and the detector, otherwise the calibration will be incorrect.
- deactivate the 'Live view'
- click on calibrate:
Fig. 8: Calibrate the detector
- After successful calibration, the red LED in the calibrate button will turn green. From now
on the detector is calibrated and the displayed images will be corrected for offset and pixel gain
- The Load bar will not be visible anymore while the intensity bar is made visible. With the
intensity bar the contrast in the displayed frame can be adjusted.
Fig. 9: After calibration, the fill degree bar disappears and the contrast/intensity bar is shown
Note: if the configuration is altered, the calibration will be incorrect, this will result in the deactivation of
the calibration status. Calibration will have to be performed again.
6
PHYWE Systeme GmbH & Co. KG © All rights reserved
P2550100
TEP
5.5.01
-01
Principles of Digital X-ray Imaging
3. Applications
Once the detector is calibrated, good quality images can be displayed, recorded and saved.
- Place one of the demo objects between the source and the detector, switch on the X-rays and
activate the live view. To place the object in front of the detector, a stand can be used. Adjust
the contrast if desired.
Fig. 10: Adjusting the contrast/intensity
- The colours of the displayed image can also be altered with three levels (Low, Middle and
High). The 'High' colour corresponds with the pixels having a value higher than the upper contrast/intensity handle. The 'Low' colour corresponds with the pixels having a value lower than
the lower contrast/intensity handle. The 'Middle' colour corresponds with the pixels having a value between than the upper and lower contrast/intensity handle.
Fig. 11: Adjusting the colours
- To save the resulting image, stop the live view and click on save. Four formats of images can
be saved (tif, png, jpg and bmp). For the three later image formats, the contrast adjustments are
retained during saving while this is not the case for the tif format. For tif, the images are saved in
a raw format. If the images will be used for further processing or measuring in the
measureCT software it is important to save them as tif.
www.phywe.com
P2550100
PHYWE Systeme GmbH & Co. KG © All rights reserved
7
TEP
5.5.01
-01
Principles of Digital X-ray Imaging
- To save a sequence of image, stop the live view and click on record sequence. Four formats of
images can be saved (tif, png, jpg and bmp). For the three later image formats, the contrast adjustments are retained during saving while this is not the case for the tif format. For tif, the images are saved in a raw format. If the images will be used for further processing or measuring in the measureCT software it is important to save them as tif.
Fig. 13: Recording a series of images
To further process an image you need to open the image viewer. When the viewer is opened, the
image that is present in the frame display will be transferred automatically to the image viewer.
The image viewer can be opened in two ways, either from the taskbar or using the shortcut button. When you are finished with the viewer, close it, otherwise the next time you open it the remaining image will still be present.
Fig. 14: Open the Image Viewer
To process images that were saved as tif, open the destination directory (fig 15). All the tif images that are present in the folder will be displayed in the list. The viewer will typically open while
listing the current operational folder and the current operational image for ease of use.
Fig. 15: Open a directory with tif- images
8
PHYWE Systeme GmbH & Co. KG © All rights reserved
P2550100
Principles of Digital X-ray Imaging
TEP
5.5.01
-01
The image viewer has several functions available.
The tif files that are present in the current operational directory are listed (fig.16.1) and
the current operational image is displayed in the image viewer display (fig.16.2). In this
display, the line profile rulers are present (fig.16.3). Additional functionalities can be accessed through the menu (fig.16.4). The histogram of the image and the contrast settings are listed on the right (fig.16.6) as well as the line profile data (fig.16.7) and the region parameters (fig.16.8). Saving and exporting options are available through several
buttons (fig.16.9) and the colour of the image levels van be adjusted ((fig.16.10).
Fig. 16: The Image Viewer functionalities
Using the image buttons (fig.16..5) it is possible:
- To select the ruler function (fig.17.1) which allows to change the line profile rulers from position (fig.16.3).
- To select several zoom functions (fig.17.2 and fig.17.4) to zoom in on a region of the image
- To select the move function (fig.17.3) to change the position of the image once it is zoomed in
on.
Fig. 17: The image buttons options
www.phywe.com
P2550100
PHYWE Systeme GmbH & Co. KG © All rights reserved
9
TEP
5.5.01
-01
Principles of Digital X-ray Imaging
Histogram
The histogram of the current image is displayed in the histogram
display (fig18.1). Such a histogram refers to the number of pixels (Yscale) with a certain grey-value (X-scale) that are present in the image. By adjusting the lower and/or upper level handle (fig18.2), the
image contrast can be altered and with the autoscale button(fig18.3), the lower and upper contrast level are reset to optimal
conditions. The histogram can be saved as an excel file (fig18.4).
Fig. 18: Histogram options
Line profile
The line profile function calculates the gray-value of each pixel along
a line from the centre of one ruler to the centre of the other ruler (fig
16.3). The result is displayed in the line profile display (fig19.1). The
line profile can be saved as an excel file (fig19.2).
Fig. 19: Line profile options
Regions parameters
The rulers of the line profile also define a
square region. By clicking on the calculate button from the region parameters (fig20), the average grey value and the spread of that region
are calculated.
Fig. 20: Region parameters
Play, Save, AVI and Convert
With the play button (fig21.1), the images that are listed in the directory are subsequently displayed, starting from the first selected
image. It is possible to save one single image under a different
formats or with other colours (fig21.2). A series of images that are
selected can be saved as an avi-movie using the AVI-button
(fig21.3) and a series of images can be converted to a different file
format using the convert button(fig21.4).
Fig. 21: Play, save, AVI functions
10
PHYWE Systeme GmbH & Co. KG © All rights reserved
P2550100
Principles of Digital X-ray Imaging
TEP
5.5.01
-01
Image viewer menu
Apart from opening a new directory, the image viewer menu
(figxxx.4) has also several other functionalities.
- set play speed: changes the speed for playing the images
www.phywe.com
P2550100
PHYWE Systeme GmbH & Co. KG © All rights reserved
11
TEP
5.5.01
-01
Principles of Digital X-ray Imaging
Theory
Detector saturation
With digital X-ray imaging, X-ray photons that interact with the detector are converted to a digital signal.
Such a digital detector is composed of a raster of pixels (picture elements) and each pixel can be considered as bucket. For each interaction of an X-ray photon with the detector, a series of electrons are
produced in the pixel corresponding with the location of the photon interaction. These electrons are
stored in the pixel, gradually filling up the bucket. After a set time interval, "exposure time", the electron
content of the pixel is measured by emptying it. For the same intensity of X-ray's, a longer exposure time
will results in a larger number of pixels in the bucket.
Each digital detector has a limited bucket size which is called the 'full well capacity' of the detector.
When this level off fill is reached, additional electrons are thrown away because the detector is saturated. A saturated detector will cause inconsistent measurements and has thus to be avoided.
Detector calibration
Each digital detector has a different and variable offset and pixel-specific output. During the calibration
these variations will be measured and used in the subsequent imaging.
Even without the X-rays on, the detector will generate a read-out value that is different from 0, called
'dark image'. This has several reasons from which the main reasons are an electronic offset and readout noise. When determining the beam intensity I0, it is important to subtract this offset (ID) from the
measured read-out (I0,M).
𝐼0 = 𝐼0,𝑀 − 𝐼𝐷
Another issue that exists, is that the sensitivity of every detector pixel is slightly different, resulting in a
wide variation of I0 values for every pixel. During calibration, these variations are recorded.
After calibration, the Transmission value for every pixel (I) is recalculated based on the beam intensity of
that pixel at that time (IM), the beam intensity during calibration(I0,M) and the dark current intensity (ID)
during calibration.
𝑇=
𝐼𝑀 − 𝐼𝐷
𝐼0,𝑀 − 𝐼𝐷
If the calibration was successfully performed, after calibration the images have grey-values between 0
and 1.
12
PHYWE Systeme GmbH & Co. KG © All rights reserved
P2550100
Principles of Digital X-ray Imaging
TEP
5.5.01
-01
Transmission and Attenuation
In X-ray imaging, the transmission or attenuation of X-rays through a certain object are measured. Depending on the settings of the source, a beam with a certain intensity I0 is measured by the detector
when no object is placed between the source and the detector. When an object is placed in the path of
the beam, this object will attenuate the beam so that the detector measures a smaller intensity I instead
of I0. The remaining intensity I compared to the original I0 is called transmission (T), which is the opposite
of the attenuation (A) of the object.
For a calibrated detector, the beam intensity is rescaled to a value between 1 and 0. With T= 1 for the
beam without an object in front of the detector (I0).
𝑇𝑜𝑏𝑗 =
𝐴𝑜𝑏𝑗 =
𝐼
= 1 − 𝐴𝑜𝑏𝑗
𝐼0
𝐼0 − 𝐼
= 1 − 𝑇𝑜𝑏𝑗
𝐼0
www.phywe.com
P2550100
PHYWE Systeme GmbH & Co. KG © All rights reserved
13


