Chapter_3-2_CEDAR_V1
advertisement
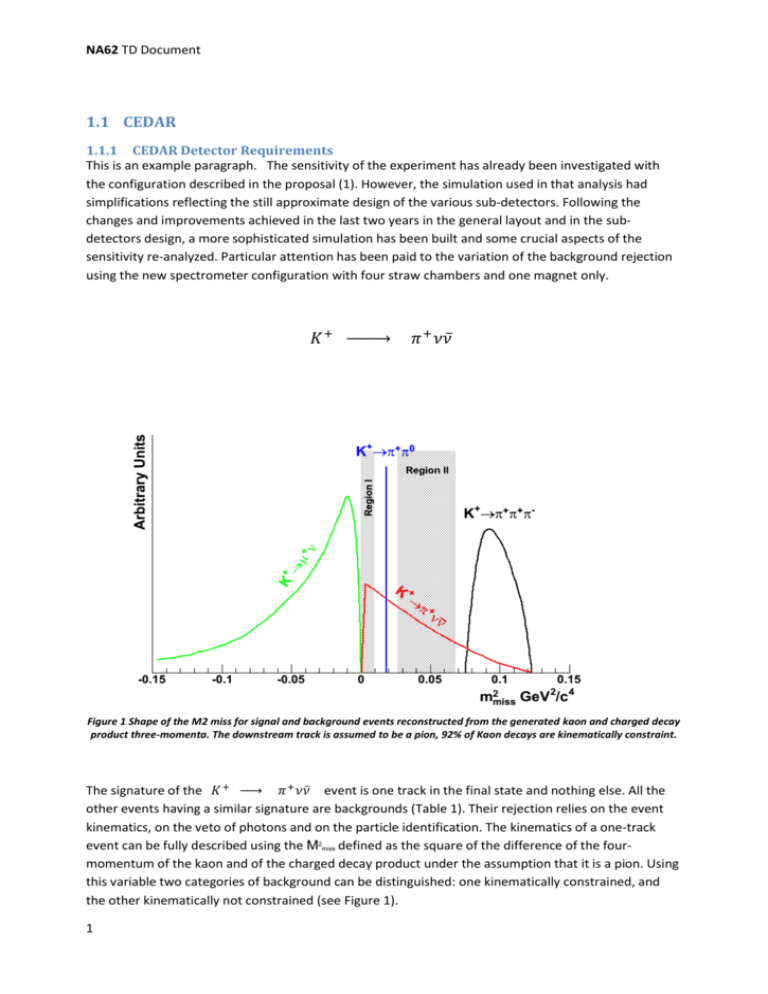
NA62 TD Document 1.1 CEDAR 1.1.1 CEDAR Detector Requirements This is an example paragraph. The sensitivity of the experiment has already been investigated with the configuration described in the proposal (1). However, the simulation used in that analysis had simplifications reflecting the still approximate design of the various sub-detectors. Following the changes and improvements achieved in the last two years in the general layout and in the subdetectors design, a more sophisticated simulation has been built and some crucial aspects of the sensitivity re-analyzed. Particular attention has been paid to the variation of the background rejection using the new spectrometer configuration with four straw chambers and one magnet only. 𝐾+ → 𝜋 + 𝜈𝜈̅ Figure 1 Shape of the M2 miss for signal and background events reconstructed from the generated kaon and charged decay product three-momenta. The downstream track is assumed to be a pion, 92% of Kaon decays are kinematically constraint. The signature of the 𝐾 + → 𝜋 + 𝜈𝜈̅ event is one track in the final state and nothing else. All the other events having a similar signature are backgrounds (Table 1). Their rejection relies on the event kinematics, on the veto of photons and on the particle identification. The kinematics of a one-track event can be fully described using the M2miss defined as the square of the difference of the fourmomentum of the kaon and of the charged decay product under the assumption that it is a pion. Using this variable two categories of background can be distinguished: one kinematically constrained, and the other kinematically not constrained (see Figure 1). 1 Draft 29/05/2009 Table 1 This is an example Table. Branching ratios of background decay channels. Decay Branching Ratio + K K2) + + 0 + + + - + 0 0 K (K K K 0.64 0.21 0.07 This is a test paragraph written with normal style. This example shows a table (see Table 2) Table 2 Example Table with Caption. Detector GTK Fiducial Region Anti0 Straw Tubes RICH Beam Dump Length [m] 80 100 105 170 100 175 175 220 220 237 250 250 Z coord. 0 70 75 120 137 150 Figure 2 Schematic of the NA62 Experiment 2 NA62 TD Document 1.1.2 Vessel and Internal Optics 1.1.3 Mechanics of the new Nose 1.1.4 Gas system 1.1.5 Light Transport System 1.1.6 Photon Detectors 1.1.7 Cooling 1.1.8 Readout/Trigger Electronics (ref to TDAQ chapter) 1.1.9 Calibration and Monitoring 1.1.10 DCS (ref to DCS chapter) Bibliography 1. al., Mustermann et. This is the Title. s.l. : Internal Note, 2007. 1. 3 Draft 29/05/2009 4

![FMIHDCCHM DEI 0CCI`I il] si DOMENICA DELLE PALME.](http://s2.studylib.net/store/data/005779668_1-1cc3015d70d36cd815405ce1aa781adc-300x300.png)
