Chalgrove Primary School Profile 2014
advertisement
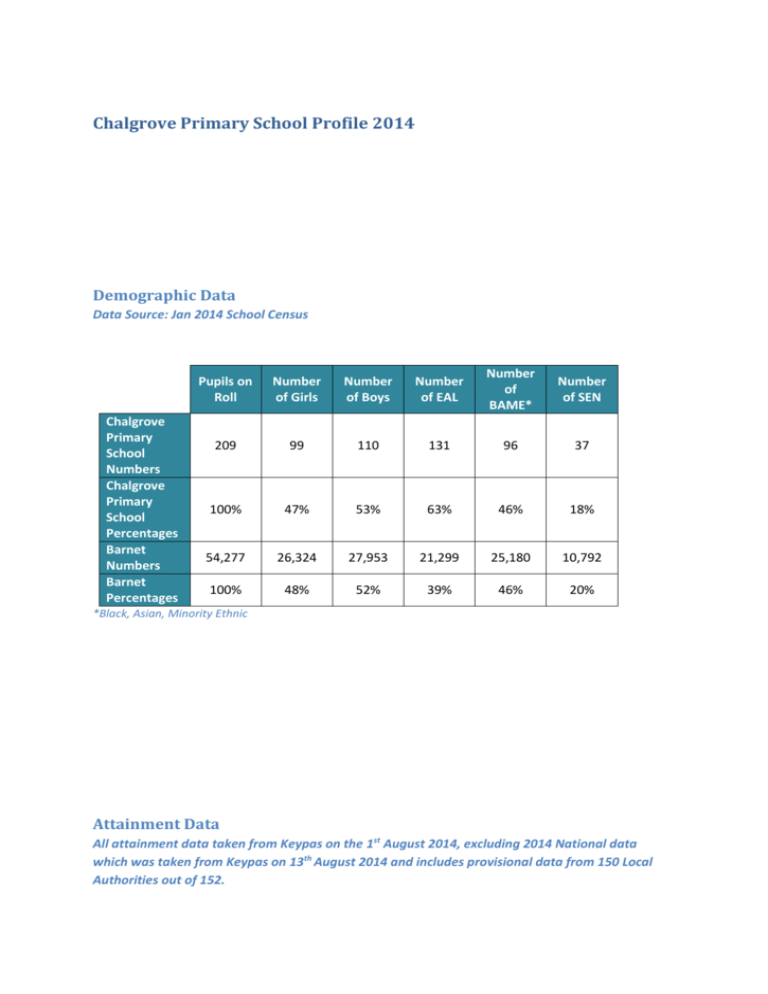
Chalgrove Primary School Profile 2014 Demographic Data Data Source: Jan 2014 School Census Chalgrove Primary School Numbers Chalgrove Primary School Percentages Barnet Numbers Barnet Percentages Pupils on Roll Number of Girls Number of Boys Number of EAL Number of BAME* Number of SEN 209 99 110 131 96 37 100% 47% 53% 63% 46% 18% 54,277 26,324 27,953 21,299 25,180 10,792 100% 48% 52% 39% 46% 20% *Black, Asian, Minority Ethnic Attainment Data All attainment data taken from Keypas on the 1st August 2014, excluding 2014 National data which was taken from Keypas on 13th August 2014 and includes provisional data from 150 Local Authorities out of 152. Early Years Foundation Stage Profile At Early Years Foundation Stage, the percentage of children in Chalgrove Primary School achieving or exceeding the expected level of development is above the Barnet average with 70% of pupils achieving a good level of development, compared to 65.5% across Barnet. The attainment gap is largest between the percentages of children achieving at least the expected level in Understanding the World (96.7% compared to Barnet’s 86.1%). The percentage gap between the borough average and children from Chalgrove Primary School having met or exceeded the expected level is smallest for Literacy at 6.7% (76.7% compared to Barnet’s 70%). All learning areas attained above the Barnet average. Foundation Stage Profile 2014: Radar Growth of % expected or exceeding against the borough average EYFSP - ALL Personal, Social and Emotional Development 100 Good Level of Development Physical Development 80 60 All Areas of Learning Summary: Communication and Language 40 20 0 Specific Areas Summary: Prime Areas Summary: Expressive Arts and Design Understanding the World Literacy Mathematics Chalgrove Primary School Barnet Foundation Stage Profile 2014: Radar Growth of % expected or exceeding against the borough average EYFSP - GIRLS Personal, Social and… 100 Good Level of… Physical… 80 60 All Areas of… Communication… 40 20 0 Specific Areas… Prime Areas… Expressive Arts and… Understanding the… Literacy Mathematics Chalgrove Primary School Barnet Foundation Stage Profile 2014: Radar Growth of % expected or exceeding against the borough average EYFSP - BOYS Personal, Social and Emotional… Good Level of 100 Physical Development 80 Development 60 All Areas of Learning Communication and 40 Summary: Language 20 0 Specific Areas Prime Areas Summary: Summary: Expressive Arts and Design Understanding the World Literacy Mathematics Chalgrove Primary School Barnet Foundation Stage Profile 2014: Radar Growth of % expected or exceeding against borough average EYFSP - FSM Eligible Communication and Language 100% Physical All Goals 80% Development 60% Personal, Social and 40% Specific Goals Emotional… 20% 0% Expressive Arts and Design Prime Goals Understanding the World Literacy Mathematics Chalgrove Primary School Barnet *8 FSM Eligible Pupils When the percentages of children attaining a Good Level of Development from all Barnet schools are compared, Chalgrove Primary School is ranked 40th out of 83 Barnet settings, putting its EYFSP performance mid table. Phonics Below is a list of all the schools in Barnet ordered by percentage of pupils working at the required standard. Chalgrove Primary School is ranked 27th out of 82, with 83% working at the required level. Percentage of Children working at (Wa) the required level at each Barnet setting (Year 1) Percentage of Children working at (Wa) the required level at each Barnet setting (Girls - Year 1) Percentage of Children working at (Wa) the required level at each Barnet setting (Boys - Year 1) *5 FSM Eligible Pupils Key Stage 1 In 2014, Chalgrove Primary School saw the percentage of pupils achieving a level 2+ in Speaking and Listening and Maths decrease from 2013; whilst the performance of KS1 Reading, Writing and Science increased. Performance in Speaking and Listening was above the national and Barnet average, but performance in all other subjects was below the Barnet and national average. The subject with the lowest percentage of pupils achieving a L2+ this year was Writing with 80% achieving L2+. The largest percentage gap (of 9%) between Chalgrove Primary School and Barnet was in KS2 Mathematics (83.3% and 92.3% respectively). Percentage of Pupils achieving L2+ key stage 1 Speaking and Listening 100 80 60 40 20 0 2010 Chalgrove Primary School 2011 2012 National (2014) 2013 Barnet 2014 Linear (Chalgrove Primary School) Percentage of Pupils achieving L2+ Key Stage 1 Reading 100 80 60 40 Percentage of Pupils achieving L2+ Key Stage 1 Writing 20 100 080 2010 2011 Chalgrove Primary School Barnet 2012 National (2014) 2013 2014 Linear (Chalgrove Primary School) 60 40 20 0 2010 Chalgrove Primary School 2011 Barnet 2012 National (2014) 2013 2014 Linear (Chalgrove Primary School) Percentage of Pupils achieving L2+ Key Stage 1 Maths 100 80 60 40 20 0 2010 2011 Chalgrove Primary School National (2014) 2012 2013 2014 Barnet Linear (Chalgrove Primary School) Percentage of Pupils achieving L2+ Key Stage 1 Science 100 80 60 40 20 0 2010 2011 Chalgrove Primary School National (2014) 2012 2013 Barnet Linear (Chalgrove Primary School) 2014 Level 2B+ Percentage of Pupils achieving L2B+ Key Stage 1 Reading 100 90 80 70 60 50 40 Percentage of Pupils achieving L2B+ Key Stage 1 Writing 30 100 20 90 10 80 0 70 2010 2011 2012 Chalgrove Primary School 60 2013 2014 Barnet National (2014) Linear (Chalgrove Primary School) 50 40 30 20 10 0 2010 Chalgrove Primary School 2011 Barnet 2012 2013 2014 National (2014) Linear (Chalgrove Primary School) Percentage of Pupils achieving L2B+ Key Stage 1 Maths 100 90 80 70 60 50 40 30 20 10 0 2010 2011 Chalgrove Primary School National (2014) 2012 2013 2014 Barnet Linear (Chalgrove Primary School) The graph below compares the attainment breakdown of each subject at Chalgrove Primary School and nationally (2014 data not available yet so it is compared to 2013). Percentage of pupils achieving each level by subject Nationally and in setting 100% 90% 80% 70% 60% 50% 40% 30% 20% 10% 0% National Chalgrove National Chalgrove National Chalgrove National Chalgrove National Chalgrove 2013 Primary 2013 Primary 2013 Primary 2013 Primary 2013 Primary School School School School School Speaking/Listening Reading 3 or above Writing 2 2A 2B Mathematics 2C 1 Science W The graph shows that in Reading and Science, Chalgrove Primary School has a higher percentage of children achieving a Level 3+ than nationally; whilst Writing had a lower proportion of children achieving Level 3+ than nationally. The subject where most children achieved a L3+ was Reading (37%) compared to National's 29%. Speaking and Listening was the subject with the best performance, categorised by 93% achieving a level 2+. A broadly similar proportion of children to nationally attained a Level W in Reading and Writing, whilst no pupils attained a level W in Speaking and Listening, Maths and Science. The percentage of pupils attaining a level 1 or below was below the percentages doing so nationally in Speaking and Listening; and above that nationally for Reading, Writing and Mathematics. Nationally in 2013 the weakest performance was in Writing, shown by: 15% not achieving a L2+, the smallest percentage of children attaining a L3+ (15%) and the highest percentage of children attaining a L1 (12%). The strongest performance was in Maths evidenced by 91% achieving a L2+, however this subject doesn’t have the highest percentage of children gaining a L3+ (23% in Mathematics compared to 29% in Reading). Percentage of pupils achieving L2+ in key stage 1 by subject (FSM Eligible*) 100 80 60 40 20 0 Reading Writing Maths National 2013 (FSM) Barnet (FSM) Speaking/Listening Science Chalgrove Primary School *4 FSM Eligible pupils Key Stage 2 At Chalgrove Primary School, performance in all KS2 subjects is higher than the national and Barnet average. The subject with the highest percentage achieving a L4+ is GPS at 96.7%. Attainment in RWM is lowest with 86.7% achieving a L4+, although this remains above the Barnet average (81.6%) and national (75%). The greatest attainment gap between Chalgrove and Barnet is in GPS at 14.4 percentage points; the smallest attainment gap is in Reading which is 2.2 percentage points. Percentage of pupils achieving L4+ in key stage 2 by subject 100 90 80 70 60 50 40 30 20 10 0 GPS Reading Writing Chalgrove Primary School Barnet Maths RWM National Percentage of pupils achieving L4+ in Key Stage 2 by Subject (Girls) 100 80 60 40 20 0 GPS Reading Chalgrove Primary School Writing Barnet Maths National (2013) RWM Percentage of pupils achieving L4+ in key Stage 2 by Subject (Boys) 100 80 60 40 20 0 GPS Reading Chalgrove Primary School Writing Barnet Maths RWM National (2013) Percentage of pupils achieving L4+ in key stage 2 by subject (FSM Eligible*) 100 90 80 70 60 50 40 30 20 10 0 GPS Barnet Reading Writing National Results (2013 FSM) Maths Chalgrove Primary School RWM *2 FSM Eligible pupils 2014 saw an increase in the percentage of pupils achieving a L4+ in all KS2 subjects from 2013; whilst performance was above the national and Barnet average in all subjects. Attainment in KS2 Writing improved the most (by 18.3 percentage points between 2013 and 2014) whilst attainment in KS2 Reading and Mathematics both improved the least (by 5.8 percentage points). The rate of improvement in all subjects was greater than the Barnet average rate of improvement. Percentage of Pupils achieving L4+ in key stage Reading Writing and Maths 100 80 60 40 20 0 2011 Barnet 2012 National (2013) 2013 Chalgrove Primary School 2014 Linear (Chalgrove Primary School) Percentage of Pupils achieving L4+ in key stage Reading 100 80 60 Percentage of Pupils achieving L4+ in key stage Writing 100 40 80 20 60 40 0 2011 Barnet 2012 National (2014) 2013 Chalgrove Primary School 2014 Linear (Chalgrove Primary School) 20 0 2011 Barnet 2012 National (2014) 2013 Chalgrove Primary School 2014 Linear (Chalgrove Primary School) Percentage of Pupils achieving L4+ in key stage Maths 100 80 60 40 20 0 2011 Level 5+ 2012 Barnet Chalgrove Primary School 2013 National (2014) 2014 Linear (Chalgrove Primary School) Percentage of Pupils achieving L5+ in Key stage Reading Writing and Maths 100 90 80 70 60 50 40 30 20 10 0 2011 Barnet 2012 National (2013) 2013 Chalgrove Primary School 2014 Linear (Chalgrove Primary School) Percentage of Pupils achieving L5+ in key stage Reading 100 90 80 Percentage of Pupils achieving L5+ in key stage Writing 70 100 60 90 50 80 40 70 30 60 20 50 10 40 0 2011 30 Barnet 2012 National (2014) 2013 Chalgrove Primary School 2014 Linear (Chalgrove Primary School) 20 10 0 2011 Barnet 2012 National (2014) 2013 Chalgrove Primary School 2014 Linear (Chalgrove Primary School) Percentage of pupils achieving L5+ in Key Stage Maths 100 90 80 70 60 50 40 30 20 10 0 2011 Barnet Progress Data 2012 National (2014) 2013 Chalgrove Primary School 2014 Linear (Chalgrove Primary School)


![afl_mat[1]](http://s2.studylib.net/store/data/005387843_1-8371eaaba182de7da429cb4369cd28fc-300x300.png)
