Name_____________________________________________ Date ______________ Period __________
The Gumball Roll Lab
Watch YouTube Video: Usain Bolt Wins The 150 Metres Race In Manchester WORLD RECORD
Have you ever ran down a hill? Do you remember what that felt like as you were
running? Did it feel the same as when you ran along a flat, horizontal surface?
What do you think would happen to Usain Bolt’s speed had he run that same race
down a hill?
In this lab you will experiment with motion. This lab will introduce you to the
science and mathematics of speed. Specifically, you will be able to answer and
support the following question. Does the height of an incline (ramp) affect the
speed of an object?
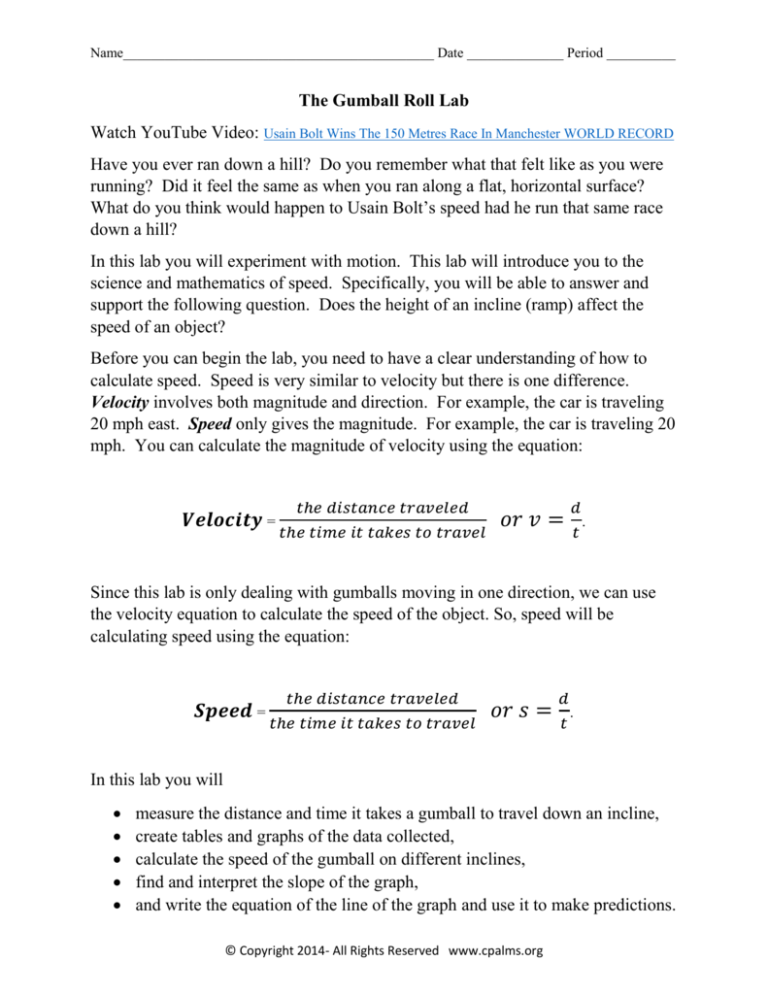
Before you can begin the lab, you need to have a clear understanding of how to
calculate speed. Speed is very similar to velocity but there is one difference.
Velocity involves both magnitude and direction. For example, the car is traveling
20 mph east. Speed only gives the magnitude. For example, the car is traveling 20
mph. You can calculate the magnitude of velocity using the equation:
𝑽𝒆𝒍𝒐𝒄𝒊𝒕𝒚 =
𝑡ℎ𝑒 𝑑𝑖𝑠𝑡𝑎𝑛𝑐𝑒 𝑡𝑟𝑎𝑣𝑒𝑙𝑒𝑑
𝑡ℎ𝑒 𝑡𝑖𝑚𝑒 𝑖𝑡 𝑡𝑎𝑘𝑒𝑠 𝑡𝑜 𝑡𝑟𝑎𝑣𝑒𝑙
𝑜𝑟 𝑣 =
𝑑
𝑡
.
Since this lab is only dealing with gumballs moving in one direction, we can use
the velocity equation to calculate the speed of the object. So, speed will be
calculating speed using the equation:
𝑺𝒑𝒆𝒆𝒅 =
𝑡ℎ𝑒 𝑑𝑖𝑠𝑡𝑎𝑛𝑐𝑒 𝑡𝑟𝑎𝑣𝑒𝑙𝑒𝑑
𝑡ℎ𝑒 𝑡𝑖𝑚𝑒 𝑖𝑡 𝑡𝑎𝑘𝑒𝑠 𝑡𝑜 𝑡𝑟𝑎𝑣𝑒𝑙
𝑜𝑟 𝑠 =
𝑑
𝑡
.
In this lab you will
measure the distance and time it takes a gumball to travel down an incline,
create tables and graphs of the data collected,
calculate the speed of the gumball on different inclines,
find and interpret the slope of the graph,
and write the equation of the line of the graph and use it to make predictions.
© Copyright 2014- All Rights Reserved www.cpalms.org
Name_____________________________________________ Date ______________ Period __________
Part 1: PREDICTION
For Experiment 1, you will be calculating the speed of the gumball from different positions with
the same incline height. Based on your observations during the POE and your knowledge of
speed, draw your prediction of the graph of distance vs. time in the graph below.
Part 2: EXPERIMENT/OBSERVATIONS 1 (Read all steps before beginning.)
Step 1:
On a flat horizontal surface, set your ramp to a height of 2 books. Position the
ramp such that the 100 cm mark is level with the very top of the book stack.
Step 2:
Measure and record the height in cm in Table 1.
Step 3:
Position the gumball in the track at 100 cm from the base of the ramp.
Step 4:
Without a pushing force, release the gumball down the ramp. Using a
stopwatch or timer, record the time in seconds it takes the gumball to reach
position “0 cm” on the ramp in Table 1.
Step 5:
Calculate and record the speed of the gumball in Table 1.
Step 6:
Repeat Steps 1 through 5 adjusting position as indicated in Table 1. Record the
data in Table 1.
TABLE 1.
Trial 1
Trial 2
Trial 3
Trial 4
Trial 5
Height of
Ramp
(cm)
2 books
2 books
2 books
2 books
2 books
= ____cm
= ____cm
= ____cm
= ____cm
= ____cm
100 cm
80 cm
60 cm
40 cm
20 cm
Position
on Ramp
(cm)
Time (s)
Speed
(include units)
© Copyright 2014- All Rights Reserved www.cpalms.org
Name_____________________________________________ Date ______________ Period __________
Graph: Use the graph below to graph the position vs. time data from Table 1. Be sure to label
axes and include appropriate units.
© Copyright 2014- All Rights Reserved www.cpalms.org
Name_____________________________________________ Date ______________ Period __________
Part 3: ANALYSIS
1. Compare and contrast your predicted graph to the actual observed graph.
2. What does the line of the graph represent? Be specific
3. How did varying the distance affect the speed of the gumball?
4. Do you feel your data was accurate? Explain your position.
5. What affect did the varying height have on the speed?
6. Complete the table. Using two points from the table, calculate the slope of
𝑦 −𝑦
the graph using the slope formula, 𝑚 = 2 1 .
𝑥2 − 𝑥1
Time(s)
x
Position (cm)
y
Show slope calculations here:
7. Using a point from the table above and the slope calculated above, write the
equation of the line in point slope form,
.
© Copyright 2014- All Rights Reserved www.cpalms.org
Name_____________________________________________ Date ______________ Period __________
Part 4: EXPERIMENT/OBSERVATIONS 2 (Read all steps before beginning.)
Step 1:
On a flat horizontal surface, set your ramp to a height of # books. (See
Table 2 for the number of books to use.)
Step 2:
Measure and record the height in cm in Table 2.
Step 3:
Position the track such that the ramp is 80 cm from the table. Level the 80
cm mark with the very top of the book stack. The ramp should extend
beyond the books 40 cm.
Step 4:
Position the gumball at the 80 cm mark. (Should be level with the very top
of the book stack.)
Step 5:
Without a pushing force, release the gumball down the ramp. Using a
stopwatch or timer, record the time in seconds it takes the gumball to
reach position “0 cm” on the ramp in Table 2.
Step 5:
Calculate and record the speed of the gumball in Table 2.
Step 6:
Repeat Steps 1 through 6 adjusting height as indicated in Table 2. Record
the data in Table 2.
TABLE 2.
Trial 1
Trial 2
Trial 3
Trial 4
Trial 5
Height of
Ramp
(cm)
1 books
2 books
5 books
8 books
10 books
= _____cm
= _____cm
= _____cm
= _____cm
= _____cm
80 cm
80 cm
80 cm
80 cm
80 cm
Position
on Ramp
(cm)
Time (s)
Speed
(include units)
© Copyright 2014- All Rights Reserved www.cpalms.org
Name_____________________________________________ Date ______________ Period __________
Graph: Use the graph below to graph the speed vs. height data from Table 1. Be sure to label
axes and include appropriate units.
© Copyright 2014- All Rights Reserved www.cpalms.org
Name_____________________________________________ Date ______________ Period __________
Part 5: ANALYSIS
1. What does the line of the graph represent? Be specific.
2. How did varying the height while keeping the position constant affect the
speed of the gumball?
3. Do you feel your data was accurate? Explain your position.
4. Complete the table. Using two points from the table, calculate the slope of
𝑦 −𝑦
the graph using the slope formula, 𝑚 = 2 1 .
𝑥2 − 𝑥1
Height(cm) Speed (cm/s)
x
y
Show slope calculations here:
5. Using a point from the table above and the slope calculated above, write the
equation of the line in point slope form,
.
© Copyright 2014- All Rights Reserved www.cpalms.org
Name_____________________________________________ Date ______________ Period __________
Part 6: CONCLUSIONS
1. Rewrite the equation from Part 3, Number 7 in slope intercept form,
y = mx + b below. Hint: Solve for “y”.
2. Given that “b” represents the y-intercept, what does “b” represent in terms of
the position and distance of the gumball in Experiment 1?
3. Summarize the effect varying position has on the speed of the gumball.
4. Relate the equation s =
𝑑
𝑡
to the equation 𝑦 = 𝑚𝑥 + 𝑏.
5. Rewrite the equation from Part 5, Number 6 in slope intercept form,
y = mx + b below. Hint: Solve for “y”.
6. Summarize the effect varying height has on the speed of the gumball.
© Copyright 2014- All Rights Reserved www.cpalms.org


