emi412047-sup-0001-si
advertisement

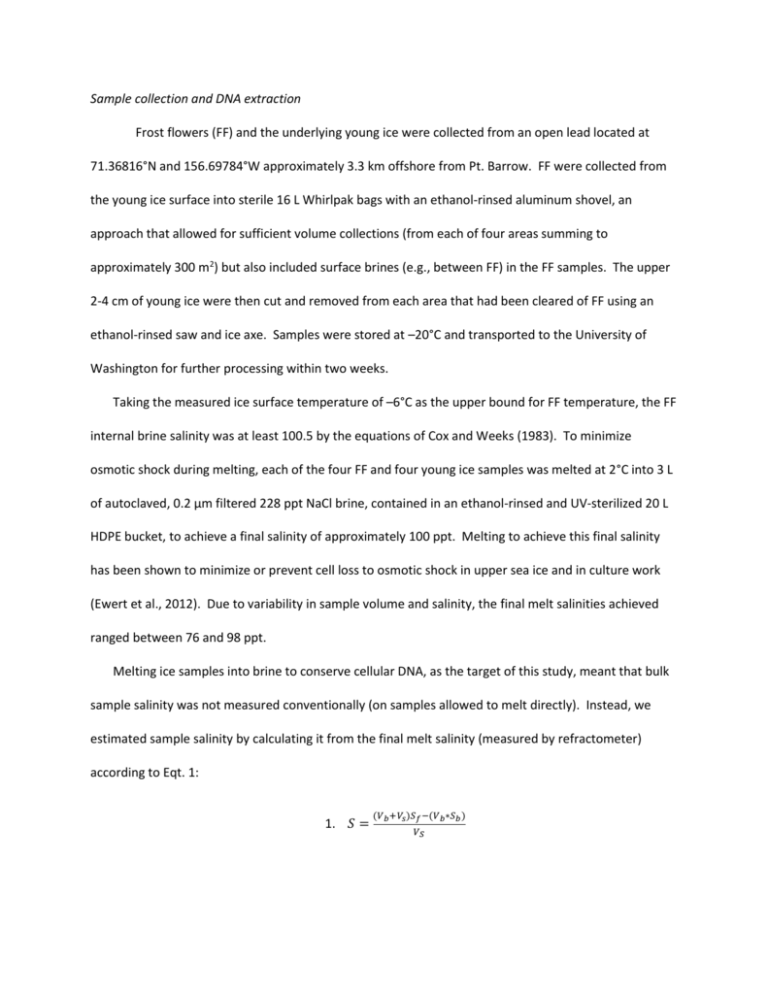
Sample collection and DNA extraction Frost flowers (FF) and the underlying young ice were collected from an open lead located at 71.36816°N and 156.69784°W approximately 3.3 km offshore from Pt. Barrow. FF were collected from the young ice surface into sterile 16 L Whirlpak bags with an ethanol-rinsed aluminum shovel, an approach that allowed for sufficient volume collections (from each of four areas summing to approximately 300 m2) but also included surface brines (e.g., between FF) in the FF samples. The upper 2-4 cm of young ice were then cut and removed from each area that had been cleared of FF using an ethanol-rinsed saw and ice axe. Samples were stored at –20°C and transported to the University of Washington for further processing within two weeks. Taking the measured ice surface temperature of –6°C as the upper bound for FF temperature, the FF internal brine salinity was at least 100.5 by the equations of Cox and Weeks (1983). To minimize osmotic shock during melting, each of the four FF and four young ice samples was melted at 2°C into 3 L of autoclaved, 0.2 μm filtered 228 ppt NaCl brine, contained in an ethanol-rinsed and UV-sterilized 20 L HDPE bucket, to achieve a final salinity of approximately 100 ppt. Melting to achieve this final salinity has been shown to minimize or prevent cell loss to osmotic shock in upper sea ice and in culture work (Ewert et al., 2012). Due to variability in sample volume and salinity, the final melt salinities achieved ranged between 76 and 98 ppt. Melting ice samples into brine to conserve cellular DNA, as the target of this study, meant that bulk sample salinity was not measured conventionally (on samples allowed to melt directly). Instead, we estimated sample salinity by calculating it from the final melt salinity (measured by refractometer) according to Eqt. 1: 1. 𝑆 = (𝑉𝑏 +𝑉𝑠 )𝑆𝑓 −(𝑉𝑏 ∗𝑆𝑏 ) 𝑉𝑆 where S = sample salinity, Vb = volume of melt brine, Vs = sample volume, Sf = final salinity of sample melted into brine, and Sb = melt brine salinity. The accuracy of this approach is limited by variability in sample volume and salinity. Mean bulk salinities (± S.D., range) calculated for the young ice and FF samples were 8.2 (± 0.76, 7.3–9.0) and 18 (± 9.1, 2.9–26), respectively. These young ice values are consistent with values of 8–10 established for upper portions of young sea ice (Weeks and Lee, 1962), but we believe the FF values are underestimates due to inaccuracy in sample volume measurement. They are also lower than previously observed in the western Arctic in springtime (Perovich and RichterMenge, 1994; Martin et al., 1995; Bowman and Deming, 2010) even accounting for brine drainage over the lifetime of the FF. Cells were harvested from the melted samples using a 0.2 μm Sterivex filter (Millipore). Cells were lysed in SET buffer (Kellogg and Deming, 2009) directly on the filter using 50 mg ml-1 lysozyme and incubating for 30 min at 30°C. Following lysis, proteins were inactivated using 20 mg ml-1 proteinase K and 90 μl ml-1 SDS. DNA was extracted using the phenol chloroform method as described in Kellogg and Deming (2009). Extracted DNA was quantified with Picogreen (Molecular Probes) following standard procedures. Aliquots (40 ml) of the melted samples were fixed with 0.2 μm filtered 37 % formaldehyde to a final concentration of 2 %. Bacterial abundance was determined from these fixed samples by double staining with DAPI and AO and enumerating by epifluorescence microscopy, counting a minimum of 20 fields and 200 cells per sample. Mean (± S.D.) bacterial abundance was 2.01 x 10⁵ (± 7.42 x 10⁴) for the FF samples and 4.64 x 10⁴ (± 9.27 x 10³) for the young ice samples. This > 4-fold difference in bacterial abundance between FF and young ice (significant by a Student’s T-test at p = 0.0061) is consistent with prior observations (Bowman and Deming, 2010). Clone library Two 16S rRNA gene clone libraries was developed from sample YI1 and FF4. DNA from the selected samples was PCR amplified using primers 27F (5’-AGAGTTTGATCMTGGCTCAG) and 1492R (5’- GGYTACCTTGTTACGACTT) under the following conditions: initial denaturation at 95°C for 150 s, then 32 cycles of 94°C for 30 s, 55°C for 1 min, and 72°C for 1 min, followed by a final extension at 72°C for 10 min. PCR products were cloned into the PCR4 vector and transformed into chemically competent cells using the TOPO TA cloning kit (Invitrogen) according to the manufacturer’s instructions. A total of 67 white and light blue colonies indicating successful transformants were picked and grown overnight on LB media with ampicillin. Cloned sequences were PCR amplified using primers M13F and M13R and submitted to the University of Washington High Throughput Sequencing Center for Sanger sequencing. Sequencing was carried out using primers T3, 519F, and T7. Contigs for 51 clones that successfully sequenced were assembled in DNA Dragon (Sequentix). The assembled sequences were checked for chimeras with the pintail algorithm in Mothur (Schloss et al., 2009) against a data base of 4,938 Bacterial and Archaeal sequences from greengenes (DeSantis et al., 2006) downloaded from the Mothur website (www.mothur.org). Chimera-checked sequences were classified with RDP Release 10 (Cole et al., 2007) using the online submission tool. Sequences for this study have been submitted to Genbank with accession numbers JX66803-JX668753. Microarray analysis Splits of the extracted DNA from each of the four FF and young ice sample were shipped to the University of Lyon for microarray analysis of the 16S rRNA gene. DNA was PCR amplified using universal primers pA (5’- TAATACGACTCACTATAGAGAGTTTGATCCTGGCTCAG) and pH-T7 (5’AAGGAGGTGATCCAGCCGCA) and the Illustra Hot Start Mix RTG PCR kit (GE Healthcare). The PCR conditions were 3 min at 94°C, followed by 35 cycles of 45 s of denaturation at 94°C, 45 s of annealing at 55°C, and 90 s of elongation at 72°C. After a final 5-min extension at 72°C, PCR products were separated by 1%-agarose gel electrophoresis, purified using the NucleoSpin Extract II kit (Clonetech), and transcribed. In vitro transcription was carried out at 37°C during 4 h with the following mix: T7 RNA buffer (5X), DDT (100 mM), 10 mM of each of the four NTPs, RNAsin (40 U µL-1), T7 RNA polymerase (1 µL) and UTP-Cy3 (5 mM). RNA was purified using the RNeasy mini kit (Qiagene) before undergoing chemical fragmentation by the addition of 5.7 µL of a Tris Cl (1mM) and ZnSO4 (100mM) mix. Samples were incubated for 30 min at 60°C and fragmentation was stopped by placing the tubes on ice. EDTA (500 mM) was added to each tube (1.2 µL) followed by 1 µl RNAsin (40 U µL-1) after a 1-min incubation period at 25°C. The RNA solution was then diluted to 5 ng µL-1 and a hybridization mix was prepared (v/v ratio) in a 50 µL reaction with 2x GeX Hyb Buffer (Agilent). A total of 100 ng of RNA were then placed on the slide and incubated at 60°C for 4 h in the Agilent Hybridization Oven. Details on chip analysis can be found in Delmont et al. (2011). T-RFLP DNA from each of the four FF and four young ice samples was amplified in the same manner as for the clone library. PCR products were purified using a GeneJet purification kit (Fermentas) prior to digestion with 5 U of HAEIII at 37°C for 3 h. After digestion the DNA fragments were purified and concentrated using Sephadex 650 (Sigma-Aldrich), spun in a turbovap until dry, and redissolved in 2.0 µL HPLC water (Sigma-Aldrich). The fragments were submitted to the Fred Hutchinson Cancer Research Center in Seattle for size fractionation and quantification on an ABI Capillary Sequencer (Invitrogen). Fragment analysis was conducted in Gelquest (Sequentix) by aligning each sample to ladder 1200 LIZ (Invitrogen) and binning to a resolution of 1 bp. To assign a putative classification to fragments of interest, 22,460 full length archaeal and bacterial sequences were downloaded from Silva (Pruesse et al., 2007). These sequences were trimmed to position 8 (corresponding to the start position for primer 27F) and digested in silico at GG|CC for restriction enzyme HAEIII. The length of the resulting fragments was compared to the fragment lengths obtained during T-RFLP. A second database was prepared in the same manner from the clone library reads produced by sequencing the forward portion of the cloned 16S rRNA gene. Metagenomic analysis DNA was amplified using the SEQPLEX whole genome amplification kit (Sigma) following the manufacturer’s protocol. Under conditions of stringent sterility 200-500 bp fragments were diluted in molecular grade water to approximately 100 pg µl-1 and amplified in triplicate reactions for 29 cycles. The reaction products and negative controls were visualized on a gel using standard methods. No product was observed in the two negative control lanes. The amplified material was purified using the GeneJet PCR purification kit (Fermentas) and the primers cleaved following the SEQPLEX protocol and provided reagents. Amplified material was purified an additional time with the GeneJet PCR purification kit. Primer free material was submitted to the Argonne National Lab for paired end sequencing on the Illumina platform with 100 bp read lengths utilizing one flow cell lane per sample. Raw reads were paired by overlapping the reverse complement of the forward read with the reverse read using a custom script. Reads which did not overlap due to sequencing error were eliminated from this preliminary analysis (24.3 % of young ice reads, 11.0 % of FF reads). Assembled reads were classified using Mothur (Schloss et al., 2009) in the manner as described for Fig. 4, with a cutoff of 60. Overlapped reads were also submitted to the MG-RAST server (Meyer et al., 2008). Taxonomic classification of reads by MG-RAST reports 56.2 % of totals reads as belonging to Rhizobiales for the FF sample and 7.2 % of total reads as belonging to Rhizobiales for the young ice sample. Comparison with other data sets To compare the Rhizobium sequences observed in this study with sequences obtained in other Arctic and Antarctic studies, sequences were obtained from Genbank for the studies given in Table 1. Six polar marine studies and four studies of Arctic soil were used along with two studies of Arctic snow. These sequences were classified using Mothur against a data base of 84,414 Bacterial and Archaeal sequences from greengenes (DeSantis et al., 2006) obtained from the Mothur website (www.mothur.org). Sequences classified as Rhizobiales with a bootstrap score of 60 or higher were extracted, aligned to a 7,682 position alignment in Mothur, and trimmed to positions 299-6,046. Sequence region varied between these studies and between the clones in our clone library. To resolve the issue of non-overlapping reads, a phylogenetic placement approach was selected for comparison. Near full-length, typed Rhizobiales sequences were obtained from the RDP. These sequences were aligned in Mothur, trimmed to positions 299-6,046, and redundant sequences were removed. FastTree (Price et al., 2010) was used to create an approximate maximum-likelihood reference tree of these sequences. The phylogenetic placement program pplacer (Matsen et al., 2010) was then used to place the Arctic and Antarctic reads on the reference tree along with our Barrow reads. To aid in visualization, reads from the larger Galand et al. (2009), Kirchman et al. (2010), and Antarctic data sets were viewed on the reference tree independently. References Bowman, J.S., and Deming, J.W. (2010) Elevated bacterial abundance and exopolymers in saline frost flowers with implications for atmospheric chemistry and microbial dispersal. Geophys Res Lett 37. Cole, J.R., Chai, B., Farris, R.J., Wang, Q., A. S. Kulam-Syed-Mohideen, D.M.M., Bandela, A.M. et al. (2007) The ribosomal database project (RDP-II): introducing myRDP space and quality controlled public data. Nuc Acids Res 35: D169D172. Cox, G.F.N., and Weeks, W.F. (1983) Equations for determining the gas and brine volumes in sea-ice samples. J Glaciol 29: 306316. Delmont, T.O., Robe, P., Cecillon, S., Clark, I.M., Constancias, F., Simonet, P. et al. (2011) Accessing the soil metagenome for studies of microbial diversity. Appl Environ Microbiol 77: 13151324. DeSantis, T.Z., Hugenholtz, P., Larsen, N., Rojas, M., Brodie, E.L., Keller, K. et al. (2006) Greengenes, a Chimera-Checked 16S rRNA Gene Database and Workbench Compatible with ARB. Appl Environ Microbiol 72: 50695072. Ewert, M., Carpenter, S., Colangelo-Lillis, J., and Deming, J. (2012) Bacterial and extracellular polysaccharide content of brine-wetted snow over Arctic winter first-year sea ice. J Geophys Res (accepted, pending revision). Galand, P.E., Casamayor, E.O., Kirchman, D.L., and Lovejoy, C. (2009) Ecology of the rare microbial biosphere of the Arctic Ocean. PNAS 106: 22427−22432. Kellogg, C.T.E., and Deming, J.W. (2009) Comparison of free-living, suspended particle, and aggregateassociated bacterial and archaeal communities in the Laptev Sea. Aquat Microb Ecol 57: 118. Kirchman, D.L., Cottrell, M.T., and Lovejoy, C. (2010) The structure of bacterial communities in the western Arctic Ocean as revealed by pyrosequencing of 16S rRNA genes. Environ Microbiol 12: 1132 1143. Martin, S., Drucker, R., and Fort, M. (1995) A laboratory study of frost flower growth on the surface of young sea ice. J Geophys Res 100. Matsen, F., Kodner, R., and Armbrust, E.V. (2010) pplacer: linear time maximum-likelihood and Bayesian phylogenetic placement of sequences onto a fixed reference tree. BMC Bioinf 11: 538. Meyer, F., Paarmann, D., D'Souza, M., Olson, R., Glass, E., Kubal, M. et al. (2008) The metagenomics RAST server - a public resource for the automatic phylogenetic and functional analysis of metagenomes. BMC Bioinformatics 9: 386. Perovich, D.K., and Richter-Menge, J.A. (1994) Surface characteristics of lead ice. J Geophys Res 99. Price, M., Dehal, P., and Arkin, A. (2010) FastTree 2 - Approximate maximum likelihood trees for large alignments. PLOS one 5: e9490. Pruesse, E., Quast, C., Knittel, K., Fuchs, B.M., Ludwig, W., Peplies, J., and Glockner, F.O. (2007) SILVA: a comprehensive online resource for quality checked and aligned ribosomal RNA sequence data compatible with ARB. Nucl Acids Res 35: 71887196. Schloss, P.D., Westcott, S.L., Ryabin, T., Hall, J.R., Hartmann, M., Hollister, E.B. et al. (2009) Introducing mothur: open-source, platform-independent, community-supported software for describing and comparing microbial communities. Appl Environ Microbiol 75: 75377541. Supplementary Figures Fig. S1. Heatmap of T-RFLP fragment relative abundance. White indicates the minimal value (0), black indicates the maximum value (0.553). Column dendrogram represents clustering by Euclidean distance between samples (Fig. 1), the FF and young ice sample clusters are significant at p < 0.05. Row labels refer to fragment length in bp.


