tohoku_aftershocks_aux_review_MI_rev3
advertisement
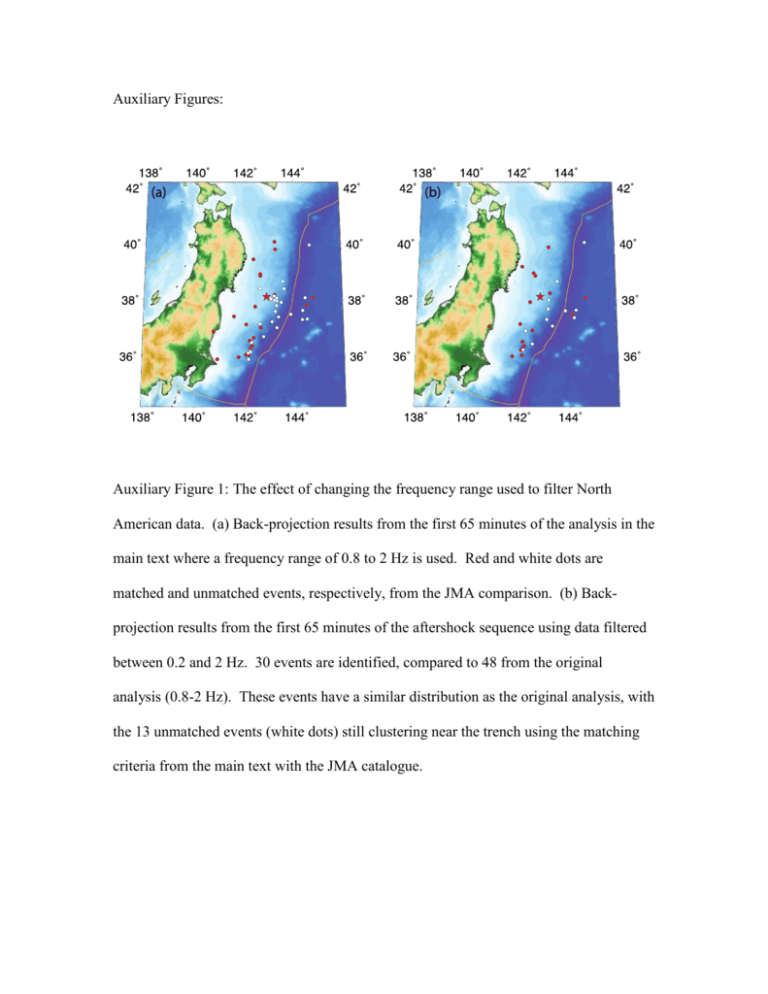
Auxiliary Figures: Auxiliary Figure 1: The effect of changing the frequency range used to filter North American data. (a) Back-projection results from the first 65 minutes of the analysis in the main text where a frequency range of 0.8 to 2 Hz is used. Red and white dots are matched and unmatched events, respectively, from the JMA comparison. (b) Backprojection results from the first 65 minutes of the aftershock sequence using data filtered between 0.2 and 2 Hz. 30 events are identified, compared to 48 from the original analysis (0.8-2 Hz). These events have a similar distribution as the original analysis, with the 13 unmatched events (white dots) still clustering near the trench using the matching criteria from the main text with the JMA catalogue. Auxiliary Figure 2: The effect of changing the reference event depth. (a) Back-projection results from the first 65 minutes of the analysis in the main text where a Mw 7.1 reference event that occurred on April 7, 2011 with a depth of 65.9 km is used. Red and white dots are matched and unmatched events, respectively, from the JMA comparison. (b) Results from the first 65 minutes of the aftershock sequence using a Mw 6.2 reference event that occurred on March 24, 2011 with a depth of 33.7 km. 24 events are identified, compared to 48 from the original analysis, though the overall spatial distribution is similar. In addition, the 10 unmatched events (white dots) are concentrated near the trench. Auxiliary Figure 3: The vertical components of local Hi-net data from the 11 closest stations aligned on the predicted P-wave arrival times from the unmatched M 6.8 event shown in Figure 9. (a) Unfiltered Hi-net data. (b) Hi-net data high-pass filtered at 5 Hz. Auxiliary Figure 4: Example of an unidentified event in the back-projection results. (a) Coherency amplitude with respect to time. The red line represents the time of a M 5.7 earthquake in the JMA catalogue. The large peak is from the M 6.8 unmatched backprojection event located close to the trench discussed in the main text (Figure 9). The yellow section captures a small peak in the time series with a signal-to-noise ratio below 2 that corresponds to the M 5.7 event in the JMA catalogue. (b) The spatial distribution of energy during the time of the yellow section in (a). The white dot with a red outline is the epicenter of the M 5.7 JMA event. The largest energy kernel near the coast can be matched with this event. The smaller energy kernel is remnant energy from the M 6.8 unmatched event discussed in the main text. This example illustrates that some of the picking criteria used in the main text (e.g., SNR ≥ 2) can cause imaged events to go unidentified. Auxiliary Figure 5: Back-projection results using synthetic seismograms that include depth phases (pP and sP) with amplitudes twice as large as P. (a) Back-projection results from a point source with a depth of 12.1 km. (b) The same as (a) except the point source depth is 19.5 km. (c) The same as (a) except the point source depth is 29.8 km. (d) The same as (a) except the point source depth is 41.8 km. (e) The same as (a) except the point source depth is 55.0 km. (f) Distance offsets of the center of the imaged energy from (a)(e) with respect to the point source depth. (g) Time offset of the imaged energy from (a)(e) with respect to the point source depth. Auxiliary Figure 6: Back-projection results using synthetic seismograms that include depth phases (pP and sP) with amplitudes twice as large as P, and a grid of possible source locations set at 65.9 km. (a) Back-projection results from a point source with a depth of 12.1 km. (b) The same as (a) except the point source depth is 19.5 km. (c) The same as (a) except the point source depth is 29.8 km. (d) The same as (a) except the point source depth is 41.8 km. (e) The same as (a) except the point source depth is 55.0 km. (f) Distance offsets of the center of the imaged energy from (a)-(e) with respect to the point source depth. (g) Time offset of the imaged energy from (a)-(e) with respect to the point source depth. Auxiliary Figure 7: (a) Effect of the discrepancy between earthquake depth and backprojection grid depth on event detection time and lateral location. Depth cross-section of the back-projection set up showing the grid plane (green line) with respect to the hypocenters of two earthquakes, one shallower than the grid depth (solid red star) and another deeper than the grid depth (solid blue star). Due to the depth difference, the back-projected energy will be shifted toward (shallow event case, star with red outline) or away from (deep event case, star with blue outline) the array direction. This is caused by the fact that, near the source region, energy stacks coherently along the ray path of the seismic phase being considered. (b) Rupture areas of a M6.0 March 11th aftershock using a horizontal plane of grid points (green contour) and a dipping plane of grid points that corresponds to the subduction interface (red contour). The horizontal plane set up causes translation of energy towards the seismic array (northeast). Auxiliary Figure 8: Focal mechanisms of earthquakes which have corresponding JMA events in the back-projection catalogue.
