Figure S1. Evolution of mean fitness on the front of a 1D
Supporting Information
standing mutations standing and new mutations
0 50 100 t (generations)
150
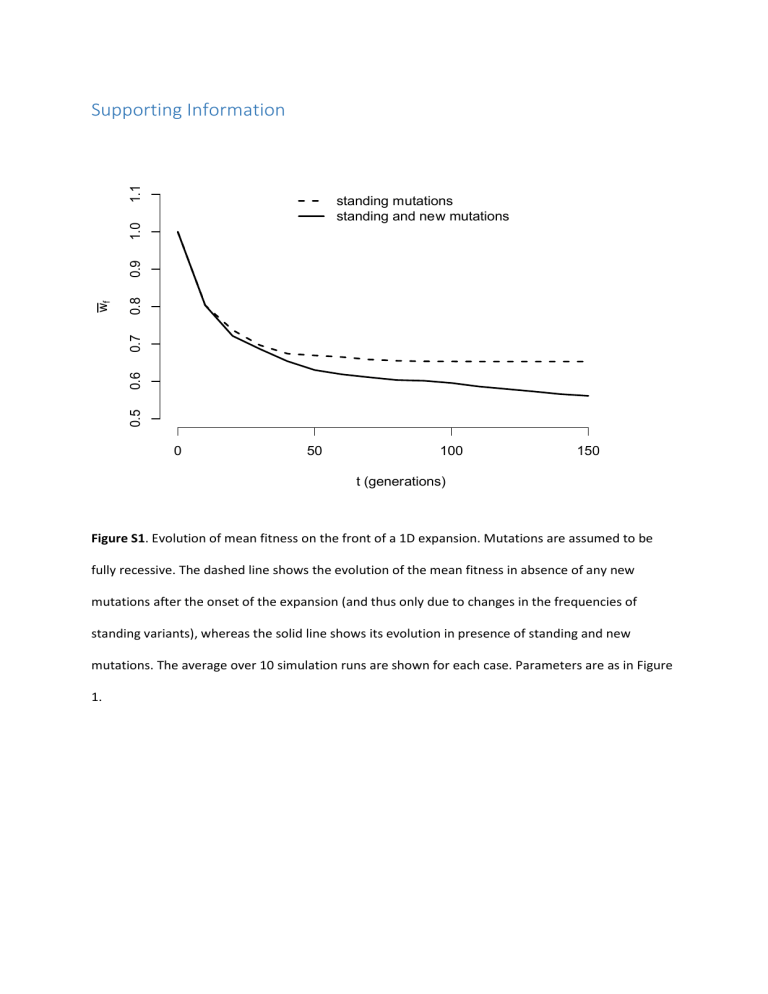
Figure S1. Evolution of mean fitness on the front of a 1D expansion. Mutations are assumed to be fully recessive. The dashed line shows the evolution of the mean fitness in absence of any new mutations after the onset of the expansion (and thus only due to changes in the frequencies of standing variants), whereas the solid line shows its evolution in presence of standing and new mutations. The average over 10 simulation runs are shown for each case. Parameters are as in Figure
1.
A m = 0.05
B
0 20 40 60 t (generations)
80 100 m = 0.25
0 20 40 60 t (generations)
80 100
Figure S2. Evolution of mean fitness at the front of a 2D expansion, in a habitat of 10x50 demes.
Mutations are recessive. Migration rates are m
0.05
(A) and m
0.25
(B). Other parameters are as in Figure 1.
A
K = 200
B
0 20 40 60 80 t (generations)
100 120
K = 500
0 20 40 60 80 t (generations)
100 120
Figure S3. Evolution of mean fitness at the front of a 2D expansion. Carrying capacities are K
200
(A) and K
500 (B). Other parameters are as in Figure S1.
A exponential DFE, s = 0.01
B
0 20 40 60 80 t (generations)
100 120 exponential DFE, s = 0.05
0 20 40 60 80 t (generations)
100 120
Figure S4. Evolution of mean fitness at the front of a 2D expansion. Mutation effects are drawn from an exponential distribution with mean s
0.01
(A) and s
0.05
(B). Other parameters are as in
Figure S1.
recessive mutations
derived allele heterozygotes derived homozygotes
0 50 t (generations)
100 150
Figure S5. Evolution of genotype frequencies at the front of a two-dimensional expansion, in a habitat of 20x50 demes. Mutations are recessive and mutation effects are drawn from an exponential distribution with mean s
0.01
. Other parameter values are as in Figure 1.
h = 0 h = 0.25
h = 0.05
h = 0.375
h = 0.125
h = 0.5
0 50 100 t (generations)
150
Figure S6. Evolution of mean fitness at the front of the expansion for varying degrees of dominance.
Other parameters are as in Figure 1.
A
core
B
C
0 0.1
0.2
0.3
0.4
0.5
0.6
0.7
0.8
0.9 1 allele frequency class
D
front
4.1 < N s
2.8 < N s < 4.1
2 < N s < 2.8
1.4 < N s < 2
0.9 < N s < 1.4
0.6 < N s < 0.9
0.3 < N s < 0.6
N s < 0.3
0 0.1
0.2
0.3
0.4
0.5
0.6
0.7
0.8
0.9 1 allele frequency class
0 < p < 0.1
0.1 < p < 0.2
0.2 < p < 0.3
0.3 < p < 0.4
0.4 < p < 0.5
0.5 < p < 0.6
0.6 < p < 0.7
0.7 < p < 0.8
0.8 < p < 0.9
0.9 < p < 1 mutation effect mutation effect
Figure S7. Distributions of segregating sites in core and front population after a 2D range expansion.
The distributions are stratified according to allele frequencies (SFS, top row) and mutation effects
(bottom row). The plots are normalized with respect to the total number of sites that segregating in any of the colonized demes. Results were recorded 150 generations after the onset of the expansion. Panels (A) and (C) show results for a core population (XY coordinates [5, 10]), (B) and (D) for a front population (XY coordinates [45, 10]). Mutations are recessive and their effects are drawn from an exponential distribution with mean s
0.02
. Other parameter values are as in Figure S1.
Statistical Analyses
To identify whether we find different heterozygosity-fitness correlations (HFC) in core and in front populations, we fitted a generalized linear mixed model to simulated data (10 replicates, 20x50 demes, parameter values as in Figure 3). We estimated the effects of several key quantities that can
be measured in experimental setups (independent variables: deme longitude, latitudinal distance from center of range, simulation number (random effect), and average heterozygosity) on mean fitness (dependent variable). We divided the analysis into three parts in order to detect differences between front and core, and to test whether HFC can potentially be detected at the individual level
(for instance in experiments with samples from a single front-population).
HFC on the expansion front
We consider here the expansion front at generation t = 150. More precisely, we interpret the line of demes at longitude 45 as the wave front. We find that heterozygosity has a significant effect on mean fitness (Table S1) and that none of the other independent variables has a significant effect on mean fitness. The intercept is approximately 0.47, suggesting that under this model the mean fitness of a fully homozygote population is expected to be only 0.47. The parameter estimates, and their standard errors and p-values are shown in Table S1.
Table S1
Coefficient
Intercept
Latitudinal distance to center
Simulation ID
Heterozygosity
HFC in core populations
Estimate
0.4677139
0.0028867
-0.0007093
2.4161080
Standard Error
0.2627963
0.0023192
0.0039999
0.5607365 p-value
< 10 -16
0.8594
0.2148
0.000026
We consider here the expansion core, i.e., the left-most 10x10 demes, before the onset of the expansion when demes are at mutation-migration-selection equilibrium, i.e., at generation t
0 .
We find that none of the independent variables has a significant effect on mean fitness. The intercept is approximately 0.9
1 u , which is the expectation for mean fitness at mutation-selection equilibrium. The parameter estimates, their standard errors and p-values are shown in Table S2.
Table S2
Coefficient
Intercept
Estimate
0.90892557
Standard Error
0.2627963 p-value
0.000179
Latitudinal distance to center
Deme coordinate (longitude)
Simulation ID
Heterozygosity
Within-deme HFC
-0.0334672
-0.0016643
-0.0128148
-0.4633313
0.0467580
0.0229855
0.0427115
1.2937457
0.474357
0.942296
0.764232
0.720341
We performed linear regression of heterozygosity and fitness for 50 individuals sampled from the same deme. Repeating this across demes at the wave front (at generation t
150 ) and across simulation replicates, we found an average regression slope of ~0.1 (with p<0.05 in 78% of demes,
Figure S8). To see whether lateral demes show stronger or weaker HFC than more central demes, we fitted a generalized linear model with individual heterozygosity and latitudinal distance to the center of the range as independent variables, and individual fitness as dependent variable. The parameter estimates, and their standard errors and p-values are reported in Table S3. We find that latitudinal distance to the center of the range has no significant effect on the strength of within-deme HFC.
Figure S8. Slope and p-values of linear regression of individual heterozygosity and fitness. Each dot represents a single deme and different colors indicate different simulation replicates. The solid horizontal line indicates a p-value of 0.05 and the dashed vertical line indicates the mean of the regression slopes. Parameter values are as in Figure 3.
Table S3
Coefficient Estimate Standard Error p-value
Intercept
Latitudinal distance to center
Heterozygosity
0.465
0.00007
1.828
0.2627963
0.0467580
1.2937457
<10 -16
0.463
<10 -16


