Remobilization of Trace Elements by Forest Fire in Patagonia, Chile
advertisement
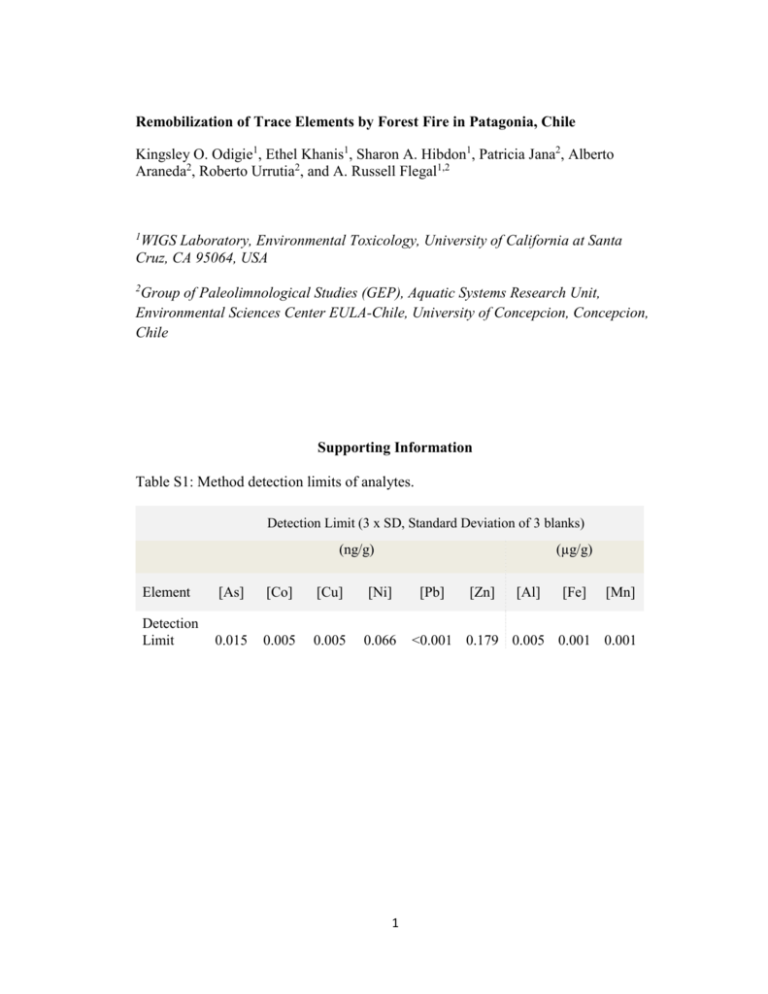
Remobilization of Trace Elements by Forest Fire in Patagonia, Chile Kingsley O. Odigie1, Ethel Khanis1, Sharon A. Hibdon1, Patricia Jana2, Alberto Araneda2, Roberto Urrutia2, and A. Russell Flegal1,2 1 WIGS Laboratory, Environmental Toxicology, University of California at Santa Cruz, CA 95064, USA 2 Group of Paleolimnological Studies (GEP), Aquatic Systems Research Unit, Environmental Sciences Center EULA-Chile, University of Concepcion, Concepcion, Chile Supporting Information Table S1: Method detection limits of analytes. Detection Limit (3 x SD, Standard Deviation of 3 blanks) (ng/g) (µg/g) Element [As] [Co] [Cu] [Ni] Detection Limit 0.015 0.005 0.005 0.066 1 [Pb] [Zn] [Al] [Fe] [Mn] <0.001 0.179 0.005 0.001 0.001 Table S2: Digestion recoveries (concentrations) for elements in standard reference materials (SRMs). % Recovery (Mean ± SD, n = 3) SRM As Co Cu Mn Ni Pb Zn Al Fe NIST SRM 1646a (Estuarine Sediment) 52.3 ± 0.8 68.2 ± 1.1 78.3 ± 4.3 88.7 ± 3.5 72.8 ± 1.9 76.5 ± 2.6 68.0 ± 0.7 51.4 ± 3.1 95.7 ± 0.8 NIST SRM 1645 (River Sediment) 97.2 ± 2.1 75.4 ± 0.2 94.6 ± 3.8 95.1 ± 1.8 86.4 ± 0.9 92.2 ± 1.1 92.2 ± 0.9 36.5 ± 1.2 89.1 ± 1.4 Table S3: Analytical (instrumental) precision. % RSD (n = 6 or 7 or 8)* % RSD (n = 5) SRM [As] [Co] [Cu] [Ni] [Pb] [Zn] [Al] [Fe] [Mn] SRM 1640a 4.6 0.9 1.1 0.9 1.1 1.1 5.2 2.1 0.9 Consistency Standard A 5.4 0.9 1.1 1.2 1.4 1.2 1.5 1.1 1.2 *n = 7 for SRM 1640a and n = 8 for Consistency Standard A; n = 6 for As Table S4: Analytical (instrumental) precision for lead isotopic compositions. % RSD (n = 5) Sample 208 Pb/207Pb 206 Pb/207Pb 207 Pb/204Pb 208 Pb/206Pb PT01 0.10 0.11 0.15 0.14 PT39 0.08 0.09 0.16 0.12 2 3 al. 2013. processed in triplicates and are reported as mean ± (standard deviation). Charcoal data were provided by Araneda et compositions of sediments collected from Lake Thompson in Patagonia, Chile. Samples marked with (*) were Table S5: Table showing the average depth, charcoal abundance, elements concentrations, and lead isotopic 4 Table S5 (continued) Table S6: Correlations of trace and major elements concentrations with charcoal abundance (particles/cm3, n = 30) in sediments collected from Lake Thompson in Patagonia. [As] [Co] [Cu] [Mn] [Ni] [Pb] [Zn] [Al] [Fe] (µg/g) (µg/g) (µg/g) (mg/g) (µg/g) (µg/g) (µg/g) (mg/g) (mg/g) r 0.71 -0.05 0.47 -0.06 0.08 0.54 0.83 0.44 -0.13 p-value <0.01 0.79 0.01 0.76 0.67 <0.01 <0.01 0.02 0.50 Table S7: Correlations of trace element concentrations with Al and Fe concentrations in sediments collected from Lake Thompson in Patagonia. Correlations of element concentrations, r (p-value), n = 41 Element with Al concentrations (mg/g) with Fe concentrations (mg/g) [As] (µg/g) 0.36 (0.019) 0.13 (0.407) [Co] (µg/g) 0.50 (0.001) 0.60 (<0.001) [Cu] (µg/g) 0.49 (0.001) 0.10 (0.543) [Mn] (mg/g) 0.57 (<0.001) 0.81 (<0.001) [Ni] (µg/g) 0.54 (<0.001) 0.49 (0.001) [Pb] (µg/g) 0.84 (<0.001) 0.47 (0.002) [Zn] (µg/g) 0.34 (0.031) -0.04 (0.811) 5 6 concentrations profiles of sediments collected from Lake Thompson in Patagonia, Chile. Figure S1. Charcoal abundance, trace elements (Co, Cu, Mn, and Ni) concentrations, and major elements (Al and Fe) Figure S2. Enrichment factors (EFs, normalized to Fe) of trace elements in sediments collected from Lake Thompson in Patagonia, Chile. Figure S3. Age and sedimentation rate of sediments computed using a parallel core collected from Lake Thompson in Patagonia, Chile. 7
