MPM 1D EXAM REVIEW linear relations
advertisement
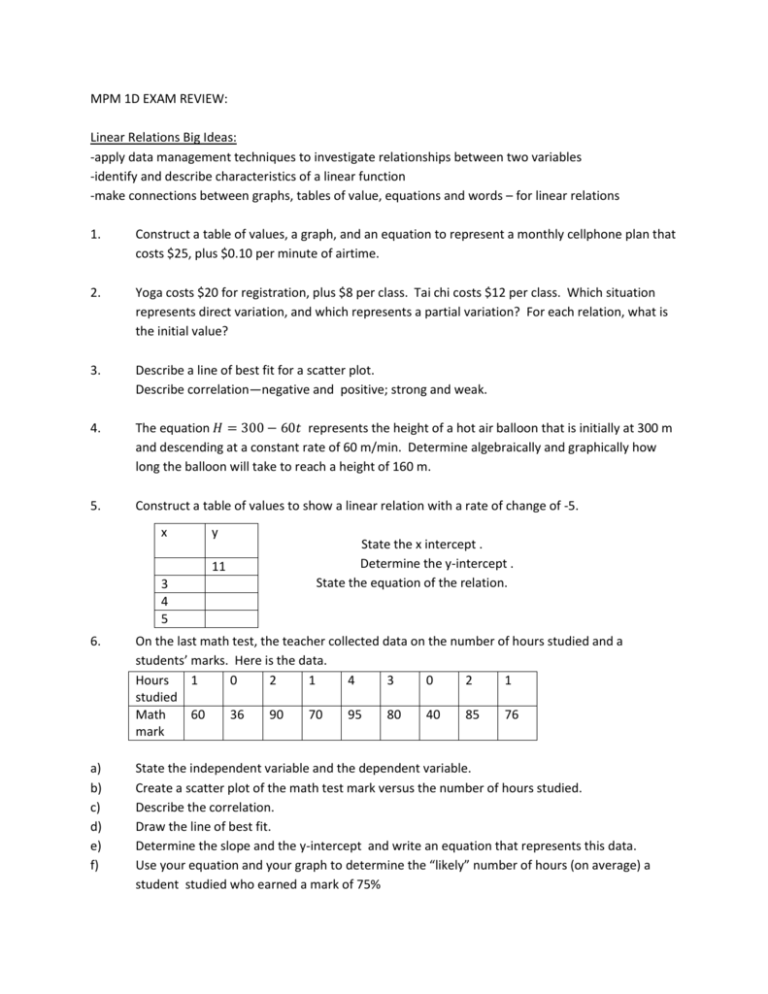
MPM 1D EXAM REVIEW: Linear Relations Big Ideas: -apply data management techniques to investigate relationships between two variables -identify and describe characteristics of a linear function -make connections between graphs, tables of value, equations and words – for linear relations 1. Construct a table of values, a graph, and an equation to represent a monthly cellphone plan that costs $25, plus $0.10 per minute of airtime. 2. Yoga costs $20 for registration, plus $8 per class. Tai chi costs $12 per class. Which situation represents direct variation, and which represents a partial variation? For each relation, what is the initial value? 3. Describe a line of best fit for a scatter plot. Describe correlation—negative and positive; strong and weak. 4. The equation 𝐻 = 300 − 60𝑡 represents the height of a hot air balloon that is initially at 300 m and descending at a constant rate of 60 m/min. Determine algebraically and graphically how long the balloon will take to reach a height of 160 m. 5. Construct a table of values to show a linear relation with a rate of change of -5. x y 11 3 4 5 State the x intercept . Determine the y-intercept . State the equation of the relation. 6. On the last math test, the teacher collected data on the number of hours studied and a students’ marks. Here is the data. Hours 1 0 2 1 4 3 0 2 1 studied Math 60 36 90 70 95 80 40 85 76 mark a) b) c) d) e) f) State the independent variable and the dependent variable. Create a scatter plot of the math test mark versus the number of hours studied. Describe the correlation. Draw the line of best fit. Determine the slope and the y-intercept and write an equation that represents this data. Use your equation and your graph to determine the “likely” number of hours (on average) a student studied who earned a mark of 75% 7. Student Council wants to plan a “Mystery Bus Trip” for the first 100 students that sign up. Student Council must decide between Location A and Location B. The cost of each trip is: Location A: $1000 for the buses and $40 per student Location B: $1600 for the buses and $32 per student Let “n” be the number of students who go on the trip and let “C” be the TOTAL cost of the trip. a) Write an equation for each location. b) Complete a table of values for each Location. c) Graph each equation and determine the point of intersection. d) What does the point of intersection mean in the context of this question? e) Under what circumstances should Student Council pick LocationA? Location B? f) Suppose they add a third location, Location C, that charges $1200 for buses and $35 per student. Describe how this graph would look in comparison to the graphs for locations A and B. 6. 7. State the formula for slope. Are the points A(40,-10), B(-8,2) and C(24,-6) collinear.


