question_1 - Homework Market
advertisement

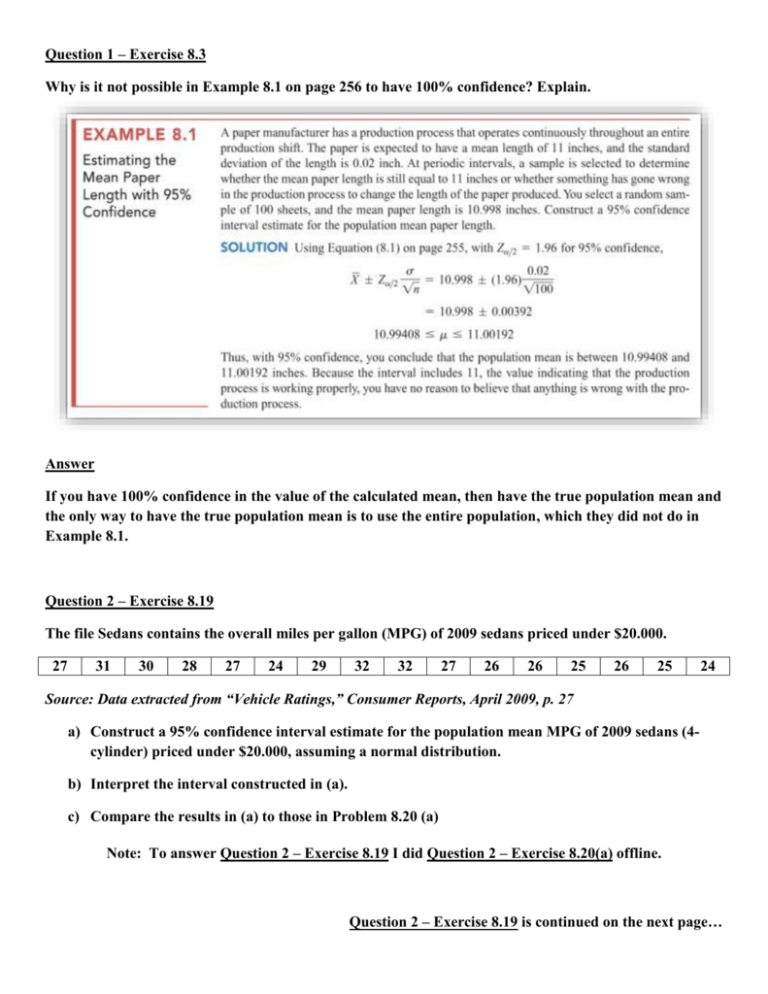
Question 1 – Exercise 8.3 Why is it not possible in Example 8.1 on page 256 to have 100% confidence? Explain. Answer If you have 100% confidence in the value of the calculated mean, then have the true population mean and the only way to have the true population mean is to use the entire population, which they did not do in Example 8.1. Question 2 – Exercise 8.19 The file Sedans contains the overall miles per gallon (MPG) of 2009 sedans priced under $20.000. 27 31 30 28 27 24 29 32 32 27 26 26 25 26 25 24 Source: Data extracted from “Vehicle Ratings,” Consumer Reports, April 2009, p. 27 a) Construct a 95% confidence interval estimate for the population mean MPG of 2009 sedans (4cylinder) priced under $20.000, assuming a normal distribution. b) Interpret the interval constructed in (a). c) Compare the results in (a) to those in Problem 8.20 (a) Note: To answer Question 2 – Exercise 8.19 I did Question 2 – Exercise 8.20(a) offline. Question 2 – Exercise 8.19 is continued on the next page… Question 2 – Exercise 8.19 (Continued…) Answer: Part (a) 𝒔 𝟐. 𝟔𝟓𝟕𝟓 𝑪𝒐𝒏𝒇𝒊𝒅𝒆𝒏𝒄𝒆 𝑰𝒏𝒕𝒆𝒓𝒗𝒂𝒍 = 𝒙 ± 𝒕 𝑺𝑬𝒙 = 𝒙 ± 𝒕 ( ) = 𝟐𝟕. 𝟒𝟑𝟕𝟓 ± 𝟐. 𝟏𝟑𝟏𝟒 ( ) √𝒏 √𝟏𝟔 𝑪𝒐𝒏𝒇𝒊𝒅𝒆𝒏𝒄𝒆 𝑰𝒏𝒕𝒆𝒓𝒗𝒂𝒍 = 𝟐𝟕. 𝟒𝟑𝟕𝟓 ± 𝟏. 𝟒𝟏𝟔𝟎 𝑪𝒐𝒏𝒇𝒊𝒅𝒆𝒏𝒄𝒆 𝑰𝒏𝒕𝒆𝒓𝒗𝒂𝒍 𝒊𝒔 𝟐𝟔. 𝟎𝟐𝟏𝟓 ≤ 𝝁 ≤ 𝟐𝟖. 𝟖𝟓𝟑𝟓 Answer: Part (b) I can be 95% confident that the true population mean of MPG of 2009 sedans (4-cylinder) priced under $20,000 is between 26.0215 and 28.8535 assuming a normal distribution. Answer: Part (c) I can be 95% confident that the true population mean of MPG of 2009 small SUV’s is less than the true population mean of MPG of 2009 sedans (4-cylinder) priced under $20,000 since the two confidence intervals do not overlap. Question 3 – Exercise 8.22 One of the major measures of the quality of service provided by any organization is the speed with which t responds to customer complaints. A large family-held department store selling furniture and flooring, including carpet, had undergone a major expansion in the past several years. In particular, the flooring department had expanded from 2 installation crews. The store had the business objective of improving its response to complaints. The variable of interest was defined as the number of days between when the complaint was made and when it was resolved. Data were collected from 50 complaints that were made in the last year. The data were stored in Furniture and are as follows: 54 11 12 13 33 5 19 4 10 68 35 126 165 5 74 137 110 32 27 27 31 110 29 4 26 27 29 28 52 5 152 61 29 30 14 2 35 26 22 13 123 94 25 36 20 81 31 1 26 23 a) Construct a 95% confidence interval estimate for the population mean number of days between the receipt of a complaint and the resolution of the complaint. b) What assumption must you make about the population distribution in order to construct the confidence interval estimate in (a)? c) Do you think that the assumption needed in order to construct the confidence interval estimate in (a) is valid? Explain d) What effect might your conclusion in (c) have on the validity of the results in (a)? Question 3 – Exercise 8.22 is continued on the next page… Question 3 – Exercise 8.22 (Continued) Answer: Part (a) 𝑪𝒐𝒏𝒇𝒊𝒅𝒆𝒏𝒄𝒆 𝑰𝒏𝒕𝒆𝒓𝒗𝒂𝒍 𝒊𝒔 𝟑𝟏. 𝟏𝟐 ≤ 𝝁 ≤ 𝟓𝟒. 𝟗𝟔 Answer: Part (b) The population is distributed normally. Question 3 – Exercise 8.22 is continued on the next page… Question 3 – Exercise 8.22 (Continued) Answer: Part (c) Based on some of the descriptive statistics reported in Part (a), including the positive skewness number and the fact that the median (28.5) is less than the mean (43.0), and both the Normal Probability Plot and Boxplot above, the data seems to be skewed to the right; therefore, I do not believe that the assumption that the population is distributed normally is valid. Question 3 – Exercise 8.22 is continued on the next page… Question 3 – Exercise 8.22 (Continued) Answer: Part (d) Despite the population not being normally distributed, since the sample size is 50, according to the Central Limit Theorem, the t distribution can be used. Question 4 – Exercise 8.23 In New York State, savings banks are permitted to sell a form of life insurance called savings bank life insurance (SBLI). The approval process consists of underwriting, which includes a review of the application a medical information bureau check, possible requests for additional medical information and medical exams, and a policy compilation stage in which the policy pages are generated and sent tot the bank for delivery. The ability to deliver approved policies to customers in a timely manner is critical to the profitability of this service to the bank. During a period of one month, a random sample of 27 approved policies was selected, and the total processing time, in days, was a s shown below and stored in Insurance: 73 45 19 48 16 17 64 17 28 17 28 91 31 92 90 63 60 50 56 51 31 69 56 16 22 17 18 a) Construct a 95% confidence interval estimate for the population mean processing time. b) What assumption must you make about the population distribution order to construct the confidence interval estimate in (a)? c) Do you think that the assumption needed in order to construct the confidence interval estimate in (a) is valid? Explain. Question 4 – Exercise 8.23 is continued on the next page… Question 4 – Exercise 8.23 (Continued) Answer: Part (a) 𝑪𝒐𝒏𝒇𝒊𝒅𝒆𝒏𝒄𝒆 𝑰𝒏𝒕𝒆𝒓𝒗𝒂𝒍 𝒊𝒔 𝟑𝟑. 𝟖𝟗 ≤ 𝝁 ≤ 𝟓𝟑. 𝟖𝟗 Answer: Part (b) The population is distributed normally. Question 4 – Exercise 8.23 is continued on the next page… Question 4 – Exercise 8.23 (Continued) Answer: Part (c) Based on some of the descriptive statistics reported in Part (a), including the positive skewness number and the fact that the median (28.5) is less than the mean (43.0), and both the Normal Probability Plot and Boxplot above, the data seems to be skewed to the right; therefore, I do not believe that the assumption that the population is distributed normally is valid. Both the normal probability plot and the boxplot show that the population distribution is not normally distributed and is skewed to the right.


